2016 slowdown
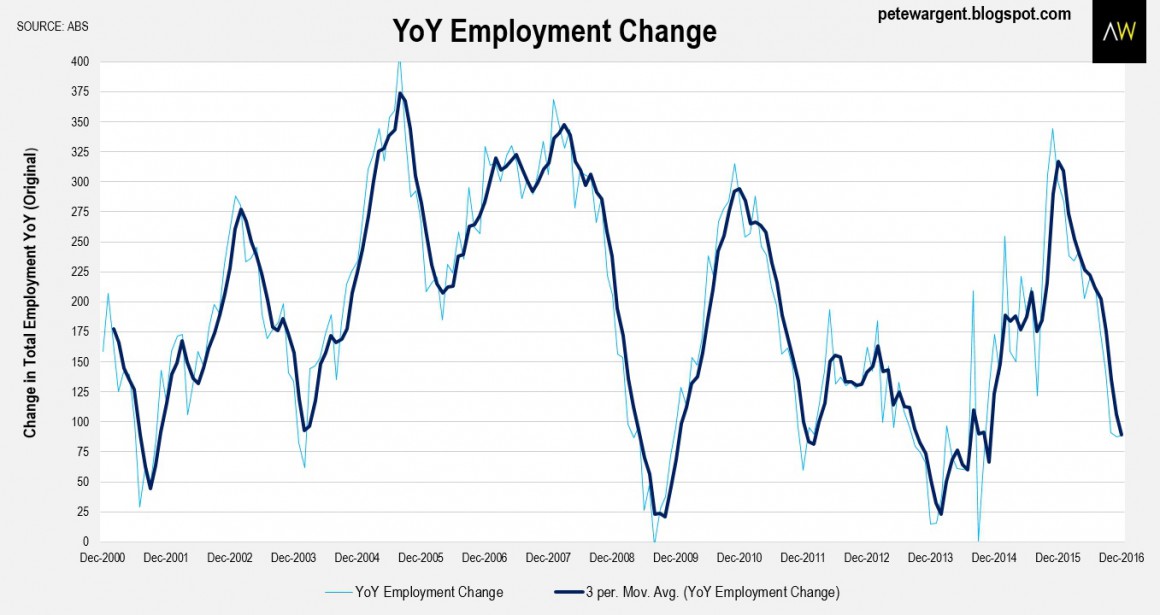
First, the good news! Total employment increased to 12,093,400 in seasonally strong December, the highest number of employed persons in Australia’s history.
After a blistering year for jobs growth in 2015 when more than 300,000 jobs were added, the last calendar year was considerably slower, with employment growth sagging to +89,2000 or +0.74 per cent.
Greater Melbourne, in essence, added the new jobs on a net basis last year.
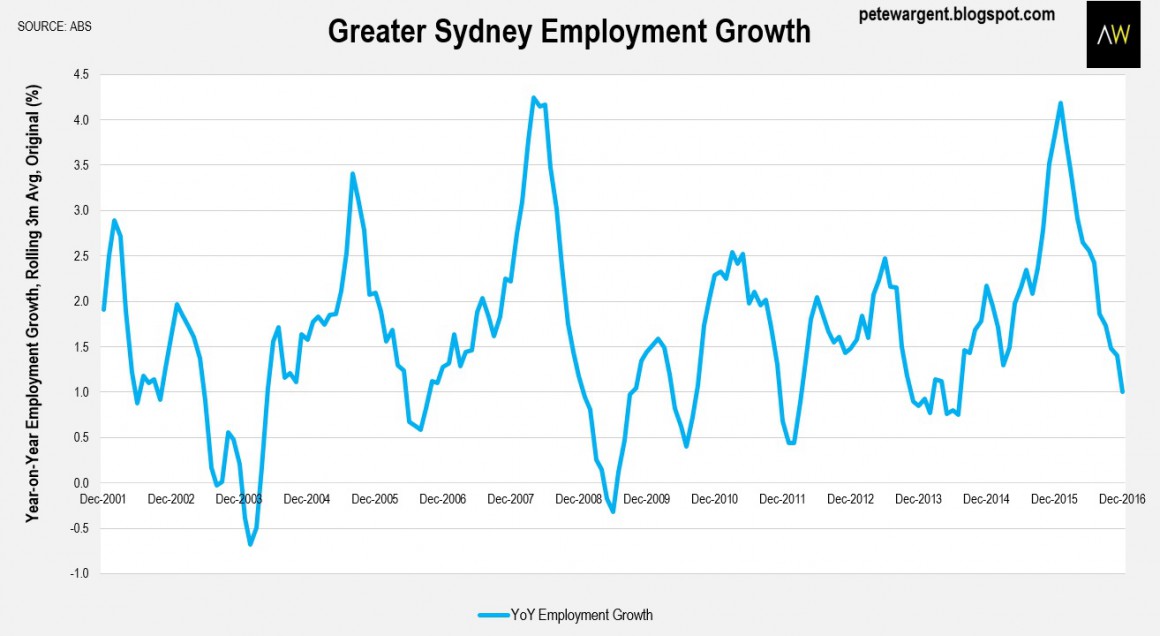
The main change during the year was that annual employment growth in Greater Sydney slowed all the way back to 1 per cent, from a massive 4.2 per cent at the 2015 peak.
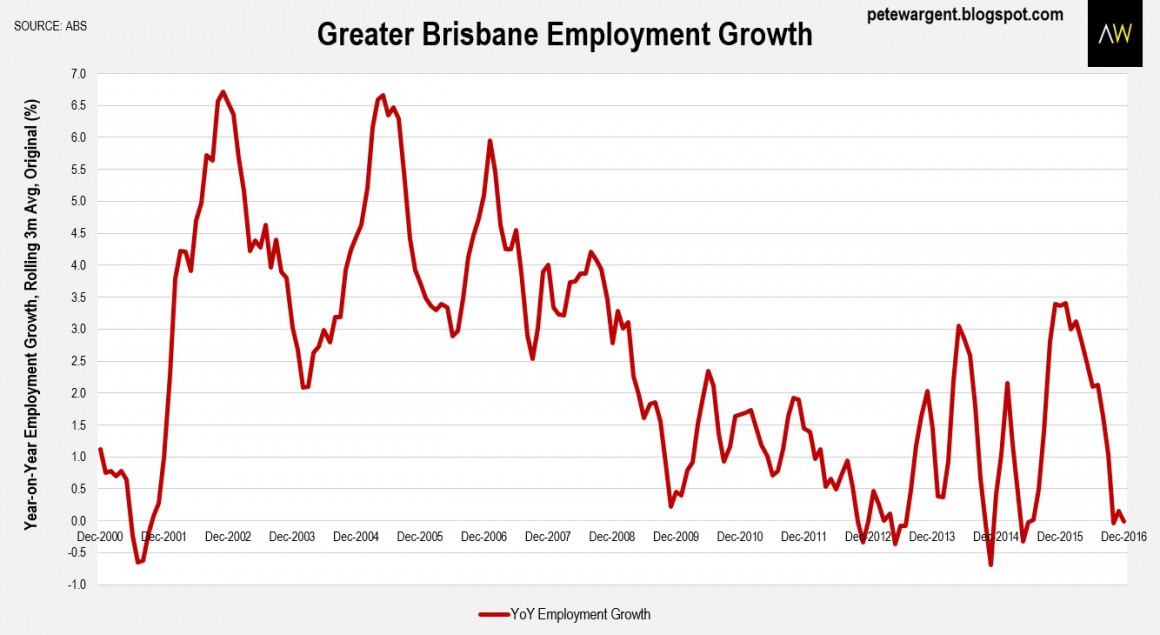
And in Greater Brisbane, employment growth stalled.
It’s not all bad news, though.
A whole range of metrics confirmed that the economy went into a very soggy patch in the third quarter of the year, reflected in a negative GDP print, but there does appear to have been a bit more momentum picking up towards the end of the calendar year.
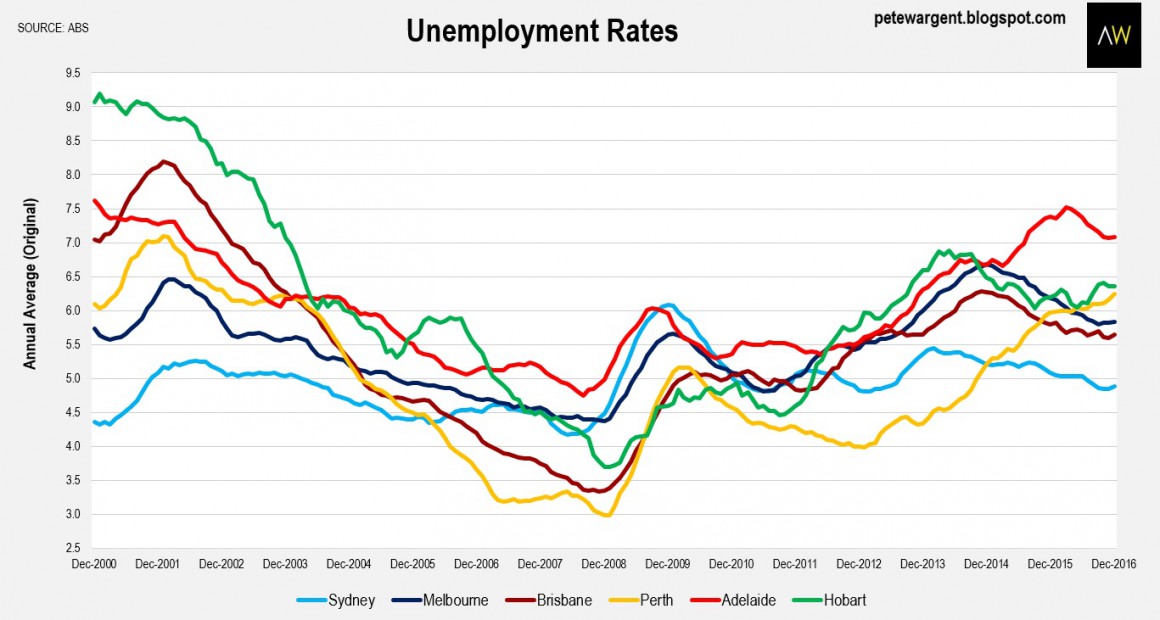
Around the major capital cities, only Greater Sydney is in fine nick from an unemployment rate perspective – sporting an unemployment rate of under 5 per cent – followed by Brisbane and then Melbourne.
In Greater Perth, the trend is still upwards.
Around the traps…
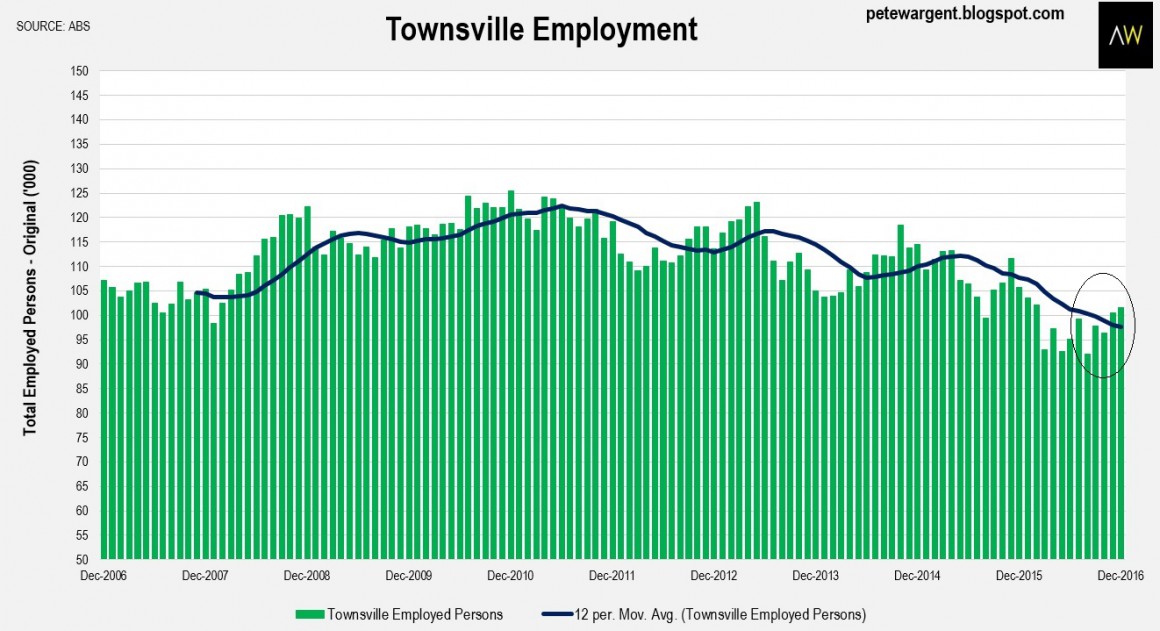
The ABS figures don’t cover all sub-regions in detail, but it’s clear that the resources-influenced regions have endured a tougher stretch since the peak of the resources construction boom in 2012.
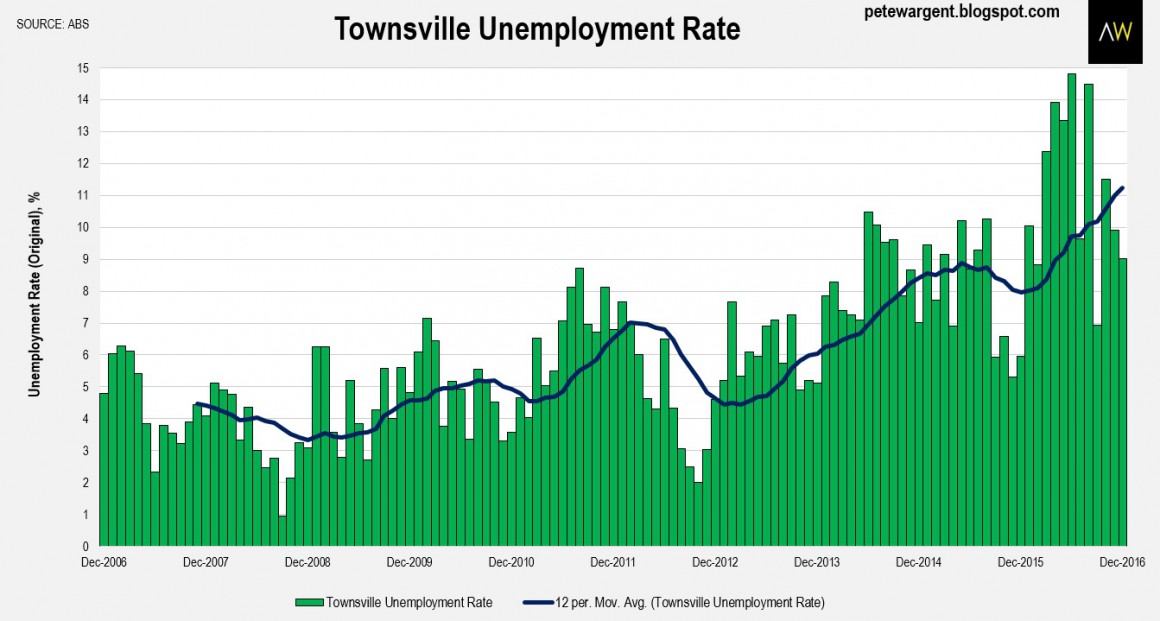
That said, it does seem that in many areas employment may now be forming a base.
You may snort with derision – as indeed you are entitled to! – but Louis Christopher of SQM Research believes that some of the hardest hit mining regions such as Karratha in Western Australia may now be passing a housing market nadir.
It’s usually well worth taking careful note of his market analysis.

No comments:
Post a Comment