Earlier this week the Australian Bureau of Statistics (ABS) released building approvals data for August 2016.
Although the data showed a fall in the number of dwellings approved for construction, on an historic basis they remain at an extremely high level.
In fact, the 20,788 dwelling approvals over the month of August was the third highest number of monthly approvals on record despite a -1.8% fall relative to July figures.
Looking at the split between houses and units, there were 9,475 houses and 11,313 units approved for construction over the month with unit approvals also at their third highest monthly number on record.
Over the month, house approvals fell by -0.9% and unit approvals were -2.5% lower.
Despite the easing, approvals remain unquestionably strong at this point of a very mature construction phase.
It will be interesting to see how many of these recent approvals, particularly of units, actually end up being constructed.
The Reserve Bank (RBA) released its monthly financial aggregates data for August 2016 last week.
According to the data, there was $2.587 trillion in outstanding credit to Australian lenders, of which $1.584 trillion or 61.3% was for residential housing.
This data is further split into $1.030 trillion in lending for owner occupiers and $554.2 billion to investors.
Over the past year, total credit for housing has increased by 6.5% which is its slowest annual rate of increase since June 2014.
The two components show that owner occupier credit is 7.6% higher over the past 12 months and investor credit rose by 4.6%.
The annual change in owner occupier credit has slowed as the monthly change has slowed.
Investor credit has increased at its slowest annual rate since October 2009 over the past year however, monthly data indicates that it has been steadily increasing for the past five months.
The ABS released retail trade data earlier this week and it showed that over the month of August, retail trade nationally increased by 0.4% to be 0.5% higher over the quarter and 2.8% higher over the past 12 months.
This represents a marked slowdown in retail trade from an annual increase of 4.5% in August 2015.
Over the year the industries with the greatest increases in retail trade were: clothing, footwear and personal accessory (6.9%), cafes, restaurants and takeaway food services (5.9%) and food (2.6%). Conversely, the change in retail trade was much more moderate for: department stores (-2.4%), household goods (1.6%) and other (2.1%).
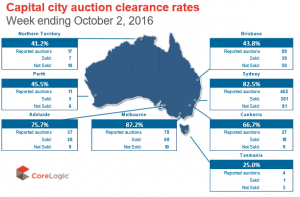
Auction volumes fell significantly last week due to long weekends and the AFL and NRL grand finals with just 872 capital city auctions, down from 2,480 the previous week.
CoreLogic collected results for 81% of auctions over the week.
The final clearance rate was recorded at 75.8%, up from 75.4% over the previous week.
In Melbourne last week there were 114 auctions, down from 1,103 the previous week.
On a much lower volume, the auction clearance rate jumped to 87.2% from 77.2% the previous week.
Sydney’s auction clearance rate was recorded at 82.5% across 530 auctions last week, with clearance rates increasing from 80.4% over the previous week across 946 auctions.
Melbourne auction clearance rate has now been above 75% for eight consecutive week while in Sydney clearance rates have been above 80% for five weeks in a row.
With auction volumes set to surge much higher this week it will be interesting to see if the recent auction market strength can be maintained.
Note that sales listings are based on a rolling 28 day count of unique properties that have been advertised for sale.
There were 45,634 newly advertised properties added to the market nationally over the past 28 days which was 0.5% higher than at the same time a year ago while there were 231,650 total properties advertised for sale over the same period which was -1.9% lower than a year ago.
Across the combined capital cities, there were 27,337 newly advertised listings over the past 28 days which was -2.6% lower than a year ago and 103,739 total listings which was 3.4% higher than a year ago.
Newly advertised listings are currently lower than a year ago in Sydney (-16.1%), Melbourne (-2.2%), Adelaide (-2.5%) and Canberra (-4.7%) with new listings higher elsewhere.
In terms of total properties advertised for sale, supply is lower than a year ago in Sydney (-4.1%), Hobart (-26.9%) and Canberra (-12.8%).
Despite the fact that new and total listings are slightly lower than they were a year ago, the number of both have been trending higher however, the most recent weak has seen a moderate decline in both new and total listings.


No comments:
Post a Comment