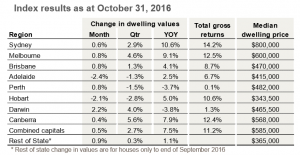
The CoreLogic October Home Value Index results show that capital city dwelling values have reached new record highs for the month, with values rising across six of the eight capitals.
According to CoreLogic research, capital gains remained positive across Australia’s combined capital city housing markets, however, the pace of growth has reduced when compared with previous months, with October dwelling values rising by 0.5%, compared with a 1.0% lift in September and 1.1% rise in August.
The latest monthly housing market data takes the quarterly change in capital city dwelling values to 2.7% and 7.5% higher over the past twelve months.
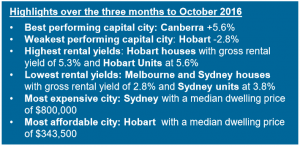
Apart from Adelaide (-1.3%) and Perth (-1.5%), every capital city recorded a rise in dwelling values over the past three months, with the Canberra housing market recording the largest increase in values after a 5.6% quarterly rise.
The strong conditions across the Canberra market are largely related to rising house values, with unit values increasing at less than half the pace of detached housing.
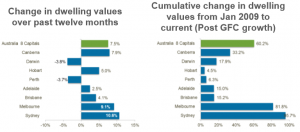
The Sydney property market continued as the stand out based on annual capital gains, recording the largest year-on-year increase; dwelling values are now 10.6% higher over the past 12 months.
Detached houses (+10.9%) are showing only a slightly higher rate of capital gain compared with units (+9.1%) across Sydney, highlighting the healthier supply/demand dynamic that exists across the Sydney region for higher density housing.
This also points to higher demand for Sydney units considering how expensive Sydney houses have become.
Units generally provide a more affordable option for home ownership and investment for many buyers.
In most other markets, detached housing is generally outperforming the unit sector as concerns around the high number of units available for sale in the market dent buyer confidence, coupled with lending policies for unit stock becoming tighter.
The divergence in performance between houses and units is most clearly evident in Melbourne and Brisbane.
The annual rate of capital gains in the Melbourne property market remains strong at 9.1%, however there is a substantial difference in growth rates between houses and units, with house values up 9.6% compared with a 5.2% increase in unit values over the past year.
Brisbane’s housing market has shown a larger capital gain spread, with house values up 4.7% compared with a 1.4% fall in unit values over the year.
The weaker performance of unit values across the Brisbane market may be partially attributed to supply concerns, as unit supply levels across key regions of Brisbane’s inner city show the potential for a significantly larger relative increase in existing stock levels when compared with Melbourne and Sydney.
The CoreLogic Settlement Risk report is currently tracking approximately 49,000 units that have been approved for construction across the broad Brisbane metro region.
While it’s unlikely that all projects will proceed through to commencement, based on the approval numbers across Brisbane, we could see an uplift in existing unit stock which is in excess of 25% over the next two years.
Comparatively, in Sydney and Melbourne, the approved unit pipeline is higher at approximately 96,000 over the next 24 months, however the potential stock uplift is much less significant, at 13% and 16% respectively relative to existing unit stock levels.
According to CoreLogic, another sign of market strength can be seen in auction results.
Auction clearance rates, which are one of the most timely measures of the fit between buyer and seller expectations, have been tracking in the mid to high 70% range across the combined capital city markets, with the largest auction markets of Melbourne and Sydney general showing a higher rate of clearance.
In fact, over the past two months, clearance rates across Sydney have dipped below 80% only once.
A year ago auction clearance rates were consistently trending around the mid 60% range, albeit on volumes that were about 20% higher.
The strong housing market growth results are continuing to occur on a back drop of low stock levels and low transactional activity.
The latest national listing estimates from CoreLogic show total listing numbers remain 2.6% lower than a year ago, with the most substantial drop in listing numbers over the year recorded in Hobart, where there are almost one third fewer homes listed for sale.
Canberra stock levels are 15% lower than a year ago and listing numbers in Sydney remain subdued, tracking 9.6% lower than last year.
Low stock levels tend to create a higher level of urgency in the housing market as buyers compete with each other and vendors are less willing to negotiate on prices.
This may be one reason why transaction numbers have reduced over the year.
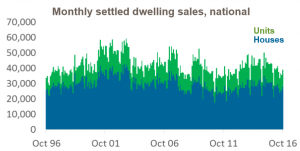
The CoreLogic turnover estimates have recently levelled after trending lower since April 2015, however settled dwelling sales over the three months ending October 31 remain 13.9% lower than the
same three month period in 2015.
These estimates do not include off-the-plan sales, which implies there is likely to be a level of upwards revision in the numbers as the record number of off the plan units move through to settlement.
Other factors that are likely to be dampening transactional activity include the high transactional costs such as stamp duty and selling fees, affordability constraints in markets where values have risen substantially and tighter lending policies being implemented by the banks.
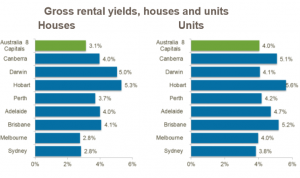
While dwelling values have broadly risen during October, rental yields in Sydney and Melbourne remain depressed, with gross yields are at record lows.
The typical Sydney and Melbourne house is now providing a gross rental return of just 2.8%.
Taking into consideration holdings costs, expenses and vacancy, the net rental yield for houses is likely to be closer to 2% in these markets.
Markets where value growth hasn’t been as strong are seeing healthier yield profiles, with Hobart demonstrating the highest gross rental yields of any capital city.
High values, low yields and a mature growth cycle haven’t been enough to deter investors from the market.
Housing credit data released by the RBA earlier this week provides some insight into increased demand from the investor segment.
Over March 2016, investor housing credit grew by just 0.29% and this has consistently increased to 0.62% over September.
At the same time, credit growth for owner occupier housing has slowed. 
After peaking at 0.79% growth in November 2015, owner occupier housing credit growth slowed to 0.49%.
While home values are still rising, the rate of growth is slower than it was 12 months ago, however, annual growth remains somewhat heightened, particularly considering this growth phase has now been running for almost four and a half years.
With ongoing strong value growth and high clearance rates in Sydney and Melbourne, as well debate around affordability gathering some momentum, there is likely to be further caution by the Reserve Bank around future interest rate cuts, which, if it were to occur, may provide additional stimulus for housing markets around Australia.






No comments:
Post a Comment