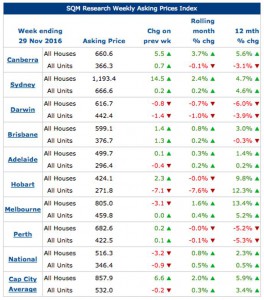
Figures released by SQM Research reveal residential asking property prices grew in most Australian cities over the year to November, with Melbourne and Hobart leading the price gains, though property in Sydney still commands the highest price.
Melbourne now leads the nation for growth in asking prices for houses, with a jump of 13.4% to $805,000 and 5.2% for units to $459,800 over the year to November.
Sydney median asking house prices have risen 4.7% to $1,193,400 over the year.
Over the month, median asking prices jumped 3.7% in Canberra to $660,600, though unit prices are edging lower.
Key Points 
- Total online national residential listings rose during November 2016 to 347,362. This figure represents a monthly rise of 2.2%, though they are down 4.2% over the year.
- Hobart recorded the largest monthly rise in stock levels, up by 7.0% to 3,402, though they are down 12.6% from a year ago.
- Sydney recorded a monthly rise in stock levels of 2.9% to 27,510, though that is still 3.8% lower than in November 2015.
- Only in Darwin did listings fall, by 0.7% over the month, reducing the number of properties for sale to 2,128.
Prices in Darwin and Perth are still falling, with the median asking price for a house in Perth at $682,600, 5.2% lower than this time last year, and $616,700 in Darwin, down 6.0%.
Meanwhile, the number of Australian residential property sale listings rose in most capital cities during November 2016.
The number of national residential property listings rose 2.2% over the month to 347,362 new listings, though they are down 4.2% from a year earlier.
Sydney property listings rose 2.9% in November, though they are 3.8% lower than a year ago.
In Melbourne, listings increased 3.0% over the month to a healthy 36,868, while in Hobart they jumped 7.0%, as some home owners try take profits on strong price gains.
Source: www.sqmresearch.com.au
Notably, asking prices for Brisbane units have edged lower over the year and downward pressure could remain on asking prices with emerging signs of oversupply in the city.
That weakness could extend to Sydney and Melbourne with some oversupply also predicted in 2017 and 2018 there due to high levels of unit construction, particularly in inner-city areas.
Elsewhere, Adelaide recorded a monthly rise of 3.5% in listings, though they are down 6.2% from a year ago.
Monthly listings jumped in Canberra by 5.9% over the month, though are down 2.5% over the year.
In Darwin and Perth listings have posted modest growth over 12 months, while in Brisbane too they are also up by a healthy 7.2% over the year, though down 2.3% over the month.


No comments:
Post a Comment