Sydney powerhouse
They rarely receive much attention – or indeed any attention at all! – but Australia’s State Accounts were released by the Australian Bureau of Statistics for FY2015-16 on Friday.
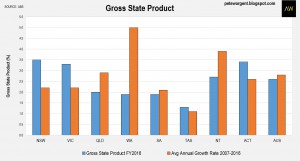
The most notable point was the dominance of the New South Wales economy which recorded a solid increase in Gross State Product of 3.5 per cent for the 2016 financial year (and a 2 per cent increase in per capita terms).
Very strong numbers!
Real Gross State Income per capita also grew by a very strong 1.4 per cent in NSW, while State Final Demand (a measure which excludes export sales) grew by a thumping 3.9 per cent.
Big numbers from a relatively large base.
While manufacturing and agriculture contracted significantly, the surge in industry Gross Value Added in NSW was driven by construction (+10.8 per cent), and finance and insurance (+4.8 per cent).
Victoria recorded very similar industry trends to NSW overall – although real state income growth was all but flat in VIC – with construction and financial services also a major driver of economic growth in Melbourne.
While the residential construction boom will continue into 2017, of course it can’t continue forever.
However, previous research by the national statistician has shown that the sector delivers a strong multiplier effect, which is positive news for the respective economies of Melbourne and Sydney.
Around the traps
Canberra has a small economy – and indeed, the ACT isn’t really a state! – but it notched solid growth in GSP of 3.4 per cent, driven mainly by public sector growth (and some apartment construction, naturally), while Queensland recorded GSP growth of 2 per cent.
Not too surprisingly, GSP growth was weaker than in the prior year at 1.9 per cent in Western Australia, though the historic data shows what a ripsnorting decade WA has had, with growth still averaging some 5 per cent per annum.
There was a big drop in income in WA due to the volatile iron ore price, but income in the forthcoming financial year is shaping up to rebound strongly in line with the fortunes of the commodity price.
Weaker economic growth was also seen in the southern states of South Australia (1.9 per cent) and Tasmania (1.3 per cent).
There’s no question that after a decade of near-stagnation in Tasmania, where GSP growth has averaged only 1.1 per cent per annum, there is now a fully fledged landlord’s market prevailing, tightening to the extent that rents and prices must surely pop higher.
However, with weak population growth and employment now declining again, in my opinion there remains a question mark over what level of growth can be sustained over the medium term.
Weak economic growth in Tasmania in 2016 was impacted by contractions in electricity, gas, water and waste services (-8.2 per cent), and agriculture, forestry and fishing (-4 per cent).
Tassie is small, cold, and quite remote on the map, but the state can potentially achieve sustainable growth if it capitalises on its points of difference to attract investment and tourism from China.
Affordability dividend for homeowners
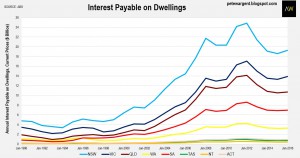
As the population of Australia grows over time and a smaller percentage share of Aussies own their homes outright, we can of course expect to see the dollar value of interest payable on dwellings increasing.
However, with interest rates having been slashed through this cycle the total interest burden relating to dwellings has fallen by 21.5 per cent since FY2012.
Indeed, total interest payable is still below where it was in FY2008, despite the population having expanded dramatically by 2.5 million or 14 per cent since that time.
That represents a huge affordability dividend for homeowners since the financial crisis.
With $56.2 billion of interest payable in the financial year, this implies an average mortgage rate on outstanding housing credit of well under 4 per cent, perhaps reflective of the increasing popularity of offset accounts.
Income growth in Sydney & Melbourne
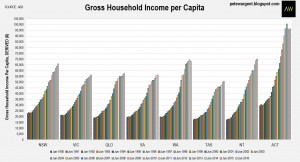
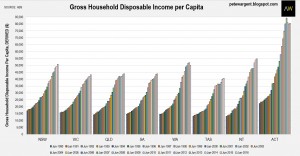
The growth in gross household income per capita
It’s important to note that these numbers are derived, so users should be wary of drawing strong conclusions from the absolute numbers, which are impacted by age distribution, the share of the population in employment, and imputed rents.
For example, the ACT always records by far the highest per capita numbers, simply because the participation rate is higher than elsewhere (retirees are not exactly flocking to Canberra for its temperate beach lifestyle, after all).
Despite the limitations of these figures, the annual growth rates around the states can be a useful indicator.
You can clearly see the impact of Hockey’s hiring freeze in FY2014 in the ACT numbers, while Canberran incomes began to lift again in FY2016 as the impact of the hiring and pay freeze thawed.
Annual growth in household disposable income per capita was also concentrated in New South Wales (+3.3 per cent) and Victoria (+2.8 per cent).
It’s important to recognise that although these numbers tend to be used in tortured housing affordability calculations, they are derived numbers and as such aren’t necessarily all that useful for doing so.
Rather, the year-on-year change is generally more significant.
The wrap
Through the investment phase of the resources boom a good deal of economic activity was generated in the resources regions of Australia.
While exports are now increasing from certain regions such as the Pilbara and Gladstone, growth in real economy has flipped back into the capital cities since 2012.

No comments:
Post a Comment