Late last week the Australian Bureau of Statistics (ABS) released retail trade data for September 2016.
Over the month, retail trade increased by 0.6% which was its greatest monthly rise since October 2015.
The 0,6% increase in retail trade in September 2016 took retail trade 3.3% higher over the past year.
Although retail trade is increasing at a rate which is well above inflation, retail is growing at a much slower annual pace than it has over recent years.
Looking at the annual change in retail trade across industries, the greatest increases were in: cafes, restaurants and takeaway food services (6.3%), clothing, footwear and personal accessory retailing (5.7%) and household goods (3.4%).
Across the remaining industries, the annual changes in retail trade were recorded at: 2.7% for food, 0.2% for department stores and 1.6% for other retailing.
The National Australia Bank (NAB) released its monthly business survey for October 2016 earlier this week.
The reading for business conditions in October was 6 points which was down from 8 points in September and its lowest reading since January of this year.
According to the index, business conditions have been trending lower since March of this year.
Business confidence was recorded at 4 points in October 2016 which was down from 6 points over the previous two months.
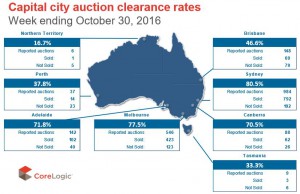
CoreLogic collected results for almost 87% of the 2,253 capital city auctions last week.
2,253 auctions were held across the combined capitals, falling from 2,680 the previous week while clearance rates also slipped lower, recorded at 74.4% from 78.1%.
Melbourne’s auction clearance rate was recorded at 77.5%
last week, down from 80.6% over the previous week while the number of auctions fell significantly from 1,377 to 632 due to the spring racing carnival.
Sydney’s auction clearance rate also fell from 82.6% the previous week to 80.5% last week.
Auction volumes were higher over the week in Sydney with 1,100 auctions compared to 897 auctions the previous week.
Auction clearance rates in Sydney and Melbourne have remained strong as volumes have increased and are well above levels from a year ago.
12 months ago, Melbourne had 629 auctions and a clearance rate of 65.6% and Sydney had a clearance rate of 60.2% from 1,391 auctions.
Note that sales listings are based on a rolling 28 day count of unique properties that have been advertised for sale.
Over the past four weeks, there were 50,128 newly advertised properties added to the market nationally which was -2.3% lower than a year ago however, new listings are at their highest level since late February of this year.
There were 241,438 total property listings over the past four weeks which was the highest number of total listings since the beginning of May this year.
New listings are currently lower than they were a year ago in most cities, the exceptions are Brisbane (+11.4%), Perth (+10.0%) and Canberra (+5.7%).
New listings are substantially lower over the year in Sydney, Hobart and Darwin.
Total advertised properties for sale are lower than a year ago in Sydney(-10.1%), Melbourne (-1.0%), Hobart (-33.1%) and Canberra (-16.4%) and higher elsewhere.
Brisbane (+14.0%) and Perth (+18.5%) are seeing a substantially higher number of total properties available for sale relative to last year.


No comments:
Post a Comment