Earlier this week the Reserve Bank (RBA) released the minutes of their November 2016 monetary policy meeting.
At the meeting the RBA board decided to keep official interest rates on hold at 1.5%.
The discussion around the housing market made for particularly interesting reading out of the minutes, below are the two paragraphs from the minutes in which housing was discussed.
‘Conditions in established housing markets had continued to diverge across the country. Housing price growth in Sydney and Melbourne had increased noticeably since earlier in the year. Members noted that high and rising population growth in Victoria, which reflected population inflows from both overseas and other parts of Australia, had supported conditions in Melbourne’s housing market. In contrast, housing market conditions had been particularly weak in Perth, where population growth had declined from earlier high rates, rental vacancy rates had risen and rents had fallen. Nationally, housing credit growth had remained lower than a year earlier at around 6 per cent per annum, although loan approvals to investors had picked up over recent months.’
‘Members noted that assessing conditions in the housing market had become more complicated. While overall conditions had eased relative to 2015, some indicators had strengthened over the previous few months. In particular, housing price growth had picked up noticeably in Sydney and Melbourne. However, housing turnover and growth in housing credit both remained lower than a year earlier, consistent with the supervisory measures that had been taken to tighten lending standards and the more cautious attitude to lending in certain segments. In addition, a considerable supply of apartments is scheduled to come on stream over the next few years, particularly in the eastern capital cities, and growth in rents in the September quarter was the slowest for some decades.’
The commentary notes that value growth is accelerating at the same time as credit growth and turnover is slowing.
The minutes indicate that the RBA believes this slowdown is due to supervisory measures to tighten lending policies.
The points which haven’t really been made but are important are that the amount of stock, particularly new stock, for sale is lower than last year, you can’t purchase what isn’t for sale.
Secondly, turnover is lower however, with a record pipeline of unit construction, the decline in turnover is not as great as it would seem at first glance because off-the-plan sales are not counted until settlement however, they are counted at their original contract date.
The residential housing market is set to remain a key area of focus for the RBA when setting monetary policy over the coming months and years.
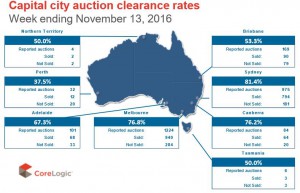
Last week there were CoreLogic collected results for just over 89% of the 2,897 capital city auctions which took place.
The 2,897 auctions last week represented an increase on the 2,517 the previous week while clearance rates rose on higher volumes.
Last week’s combined capital city auction clearance rate was recorded at 75.8%, up from 73.6% the previous week.
Last week, Melbourne’s auction clearance rate rose from 76.1% to 76.8% while auction volumes increased from 927 to 1,329.
Sydney’s auction clearance rate also rose last week from 78.8% to 81.4%.
The number of auctions was virtually unchanged with 1,089 last week compared to 1,087 the previous week.
The auction markets is the two largest cities have maintained strength throughout Spring this year.
So far during Spring, Melbourne’s clearance rate has averaged 78.8% and Sydney’s 80.9%.
In 2015, the average Spring clearance rates were 70.7%and 65.1% respectively.
The current market is also stronger than in 2014 when the Spring average clearance rates were 70.3% in Melbourne and 74.4% in Sydney.
Note that sales listings are based on a rolling 28 day count of unique properties that have been advertised for sale.
There were 50,856 newly advertised properties for sale nationally over the 28 days to 13 November 2016 and 242,525 total properties for sale.
Although the number of newly advertised properties is -1.0% lower than a year ago, new listings are at their highest level since late November of last year while total listings are -2.5% lower than a year ago but at their highest level since early June of this year.
Across the combined capital cities, the 32,135 newly advertised properties are -3.3% lower than 12 months ago while the 112,862 total listings is up 1.9% from a year ago.
Newly advertised properties are lower than they were a year ago in Sydney (-12.5%), Melbourne (-4.5%), Adelaide (-1.3%), Hobart (-2.5%) and Darwin (-26.7%).
While listings are substantially lower than a year ago in many of these cities it is somewhat more difficult to reconcile the 9,5% annual rise in Brisbane and 4.9% rise in Perth given no substantial uptick in housing demand in those cities.
In terms of total listings, although across the combined capitals they are slightly higher than a year ago, they are lower in Sydney (-10.1%), Melbourne (-1.8%), Hobart (-31.5%), Darwin (-0.2%) and Canberra (-10.6%).
There has been a somewhat counter-intuitive substantial rise in total listings in Brisbane (11.8%) and Perth (18.9%).


No comments:
Post a Comment