Earlier this week the Australian Bureau of Statistics released the quarterly national accounts data which provided an update on Australia’s economic growth for the September quarter of 2016.
The headline figures showed that the Australian economy contracted by half a percent over the quarter compared with a 0.6% rise in gross domestic product over the June quarter.
This was the first quarterly economic contraction since March 2011 when widespread flooding and cyclone activity dented commodity and agricultural exports.
The data showed annual economic growth slowed to 1.8%, which is a sharp fall from the June quarter when annual GDP growth was 3.1%.
The weak GDP reading probably isn’t quite as bad as it looks, considering the result is due to several events that are likely to be one offs.
A 1.6% fall in dwelling construction was largely the result of wet weather delaying the significant pipeline of residential construction projects.
Surprisingly, iron ore exports were down but likely to bounce back next quarter at substantially higher prices.
Government spending reduced after a surge over the June quarter and confidence was likely impacted by Brexit and the long wind up to the federal election held in July.
Overall, while the negative result is likely to act as a wakeup call for the federal government, the likelihood of a sustained downturn in economic growth seems remote.
Another important news event this week was the decision by the Reserve Bank of Australia to keep the cash rate on hold at 1.5%.
Despite inflation tracking well below the target range of 2-3%, the RBA decided to keep the cash rate on hold.
On one hand the RBA was likely considering the sluggish inflation numbers, the likelihood of a low or even negative economic growth reading when GDP data is released tomorrow, record low wage growth of 1.9% in the year to September and the loss of approximately 50,000 full time jobs in the year to October.
There are plenty of reasons why the RBA would keep rates on hold such as the rebound in housing market strength and housing investment activity, a surge in commodity prices, and potentially a lower Australian dollar as the US looks to increase interest rates.
The reacceleration in housing values in some cities was likely a topic of discussion at the RBA, particularly considering the rebound in dwelling values that has been evident across some cities coincided with the two rate cuts earlier this year.
The two rate cuts earlier this year have also been accompanied by an aggressive rise in investment activity.
A decision to cut the cash rate to new record lows could add further incentive to investors and owner occupiers which could push housing values even higher.
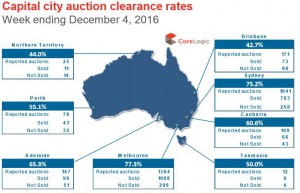
CoreLogic collected results for 89% of the 3,207 auctions held last week.
Based on these results, the final clearance rate across the combined capital cities was recorded at 72%.
The combined capitals weighted average clearance rate has been above 70% for 19 of the past 20 weeks, highlighting strong selling conditions which have been supported by low listing numbers.
Melbourne recorded the largest number of auctions (1,416) as well as the highest clearance rate across the capitals (77.3%).
The second largest auction market, Sydney, recorded 1,182 auctions last week with a clearance rate of 75.2%.
This was the lowest clearance rate for Sydney since July.
Auction volumes are set to taper over the remainder of the year and we don’t normally see auction activity bounce back until early February.
Note that sales listings are based on a rolling 28 day count of unique properties that have been advertised for sale
The number of homes advertised for sale across Australia has started the seasonal slowdown, with total listings and fresh a listing numbers started to trend lower.
Despite fewer listings, its appears that vendors have taken advantage of the strong selling conditions over the last four weeks, with a surge in newly advertised listings.
After new listing numbers were tracking lower than a year ago through most of spring, fresh stock is currently 6.6% higher than a year ago nationally and 4.6% higher than last year across the capital cities.
Total listings are also slightly higher than a year ago across the combined capitals, however the hot markets of Sydney, Melbourne, Hobart and Canberra are all seeing a diminished level of stock relative to a year ago.


No comments:
Post a Comment