The housing market is broadly continuing to see values rise due to a combination of factors but chief amongst these are low interest rates, increasing demand and strong investment returns (largely fuelled by capital growth rather than rental returns).
With interest rates forecast to remain low and demand not showing signs of waning it seems likely that values will continue to climb, the pace of this growth remains the big question mark.
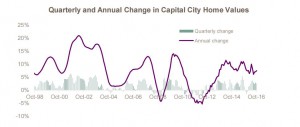
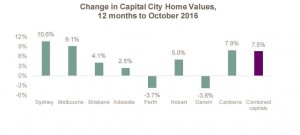
- Combined capital city home values have increased by 2.7% over the three months to October 2016, to be 7.5% higher over the past year.
- Although home values are continuing to record quite strong levels of annual growth, it is slower than 12 months ago when values had increased by 10.1% over the year.
- The annual rate of value growth in October 2016 was the fastest rate of growth since June 2016.
- House values have increased at a faster annual pace over the past year than units with rises of 7.7% and 6.3% respectively.
- Over the past five years, combined capital city home values have increased at an annual rate of 6.6% and over the past decade they have increased by 5.6% pa.
- Capital city home values have been broadly rising since June 2012 and since that time they are 42.0% higher highlighting the current growth phase has been elongated relative to previous cycles.
Sydney and Melbourne continue to record the strongest annual growth
- Throughout the current growth phase Sydney and Melbourne have recorded the strongest rates of growth and that has continued over the past year.
- In most capital cities, home values have continued to rise over the past year, the exceptions have been Perth and Darwin where values have fallen.
- Sydney home values are 10.6% higher over the past year which is a slower rate of growth than the 15.6% 12 months earlier and much lower than the recent 18.4% peak in July 2015.
- In Melbourne home value growth reached its recent peak of 14.2% in September 2015, over the past year values are 9.1% higher which is a slower rate of growth than the 12.8% a year ago.
- 12 months ago, Brisbane home values had increased by 3.8% compared to 4.1% over the past year.
- Home values in Adelaide have increased by 2.5% over the past 12 months compared to annual growth of 2.3% at the same time in 2015.
- Perth home values have fallen by -3.7% over the past 12 months which is similar to the annual decline ( -3.6%) 12 months earlier, values are now -9.7% lower than their end of month peak in December 2014.
- Over the past 12 months, Hobart home values have increased by 5.0% which is a greater annual growth rate than the 3.8% 12 months earlier.
- Home values in Darwin were –9.2% lower than their most recent end of month peak in May 2014 with values having declined by -3.8% over the 12 months to October 2016.
- In Canberra, home values have increased by 7.5% over the past 12 months compared to an increase of 4.5% over the same 12 month period a year earlier.
Total returns have reduced but remain superior to many other asset classes
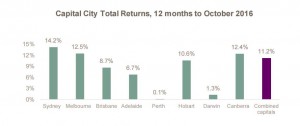
- Over the 12 months to October 2016, total property returns which factor in both capital growth and rental returns have been recorded at 11.2%.
- The strongest total returns have been recorded in the cities with the strongest value growth; Sydney (14.2%), Melbourne (12.5%), Canberra (12.4%) and Hobart (10.6%).
- Across the remaining capital cities total returns have been lower, recorded at 8.7% in Brisbane, 6.7% in Adelaide, 0.1% in Perth and 1.3% in Darwin.
Sydney and Melbourne have experienced much greater value growth over the current growth phase than all other capital cities
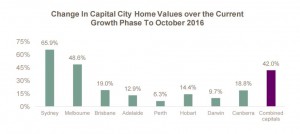
- Since combined capital city home values reached their most recent low point in May 2012, combined capital city home values have increased by 42.0%.
- It is important to note that not all cities recorded the commencement of their growth phase at this time and the following statistics look at each cities growth across the current phase from when they commenced in each city.
- Sydney and Melbourne have recorded much stronger growth in the current phase than all other capitals with values increasing by 65.9% and 48.6% respectively.
- Elsewhere, the total change in values over the current cycle has been recorded at: 19.0% in Brisbane, 12.9% in Adelaide, 6.3% in Perth, 14.4% in Hobart, 9.7% in Darwin and 18.8% in Canberra.
Growth in home values in Sydney and Melbourne have far out-stripped other capital cities since the financial crisis
- Combined capital city home values fell by -6.1% between March and December of 2008 as the financial crisis shocked global financial markets and depressed housing demand.
- The combination of a commodity price boom, aggressive interest rate cuts and stimulus for first home buyers saw home values start to rise from the end of 2008.
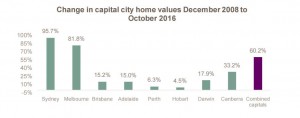
- Sydney home values have increased by 95.7% since the end of 2008 and Melbourne values are 81.8% higher over the same period.
- To put the growth in Sydney and Melbourne into perspective, the city with the third highest rate of value growth since December 2008 has been Canberra where values have increased by 33.2%.
- Across each remaining capital city, values are higher since 2008 however, the increases have been moderate, recorded at: 15.2% in Brisbane, 15.0% in Adelaide, 6.3% in Perth, 4.5% in Hobart and 17.9% in Darwin.
Sydney has a sizeable gap between selling prices of houses and units
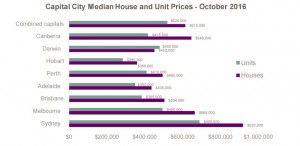
- In October 2016, the median house price across the combined capital cities was recorded at $615,000 and the median unit price was $520,000.
- In dollar value terms, Sydney has the greatest gap between house and unit prices at $230,000 followed by Canberra ($227,500), Melbourne ($170,000) and Brisbane ($119,000).
- In the remaining cities, the dollar value gap between house and unit prices are much lower at $86,000 in Adelaide, $85,000 in Perth and $75,000 in Hobart while the median house price in Darwin is $28,000 lower than the median unit price.
- In percentage terms, the largest gap between house and unit prices is in Canberra (54.4%) followed by: Melbourne (34.3%), Sydney (33.3%), Brisbane (30.9%), Hobart (26.3%), Adelaide (24.6%), Perth (20.7%) and Darwin (-5.8%).
Transaction activity has reduced but has stabilised over recent months
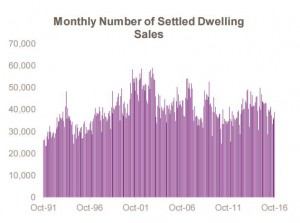
- CoreLogic estimates that over the 12 months to October 2016 there were 451,461 settled property sales nationwide.
- The number of properties sold nationally over the past year was -11.7% fewer than over the previous 12 months.
- Across the combined capital cities, there were 286,848 settled sales over the 12 months to October 2016 which was -15.0% lower than the previous 12 months. Although sales remain much lower than they were a year ago, over recent months there has been an uptick in settled sales.
- Throughout the individual capital cities, the year on year change in annual sales were recorded at: -18.2% in Sydney, -21.4% in Melbourne, -12.9% in Brisbane, +0.2% in Adelaide, -5.3% in Perth, -4.9% in Hobart, -12.5% in Darwin and -6.2% in Canberra.
- Importantly, these figures only count settled sales; off-the-plan sales are unsettled and will not settle until they are completed, at that time these sales will be counted at their contract date.
- Given this, it is expected that recent years of sales activity will be revised higher over the coming years once these settlements occur
Discounting levels have reduced over the year
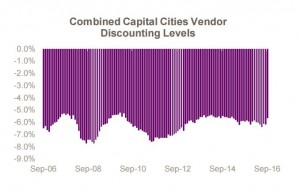
- Vendor discounting measures the difference between the initial list price and the ultimate selling price of properties which sell by private treaty for less than their original list price.
- The level of discounting by vendors is currently recorded at 5.7%, down from 6.0% a year ago.
- Over the past three months, discounting has reduced quite significantly from 6.4% to 5.7%. The current level of discounting across the individual capital cities is recorded at: 4.9% in Sydney, 5.0% in Melbourne, 5.1% in Brisbane, 6.0% in Adelaide, 8.0% in Perth, 6.6% in Hobart, 8.2% in Darwin and 4.5% in Canberra.
- Discounting levels are lower over the past year in Sydney (-0.4%), Melbourne (-1.1%), Brisbane (-0.3%), Darwin (- 0.2%) and Canberra (-0.4%).
- Across the remaining capital cities, discounting levels have increased in Adelaide (+0.3%), Perth (+0.9%) and Hobart (+0.5%).
Homes are taking slightly longer to sell than they were a year ago
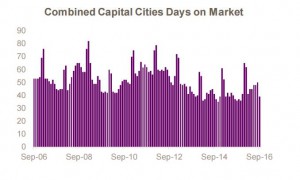
- The days on market figure measures the average time from the first listing date to the contract date for properties sold by private treaty.
- Combined capital city homes are currently taking an average of 39 days to sell compared to 36 days at the same time a year ago.
- At an individual capital city level, the average days on market is recorded at 32 days in Sydney, 31 days in Melbourne, 57 days in Brisbane, 55 days in Adelaide, 79 days in Perth, 52 days in Hobart, 71 days in Darwin and 35 days in Canberra.
- The average days on market has reduced over the past year in Melbourne (-1 day), Hobart (-7 days), Darwin (- 18 days) and Canberra (-9 days).
- Across the remaining capitals, days on market has increased with the magnitude of increase recorded at +5 days in Sydney, +14 days in Brisbane, +5 days in Adelaide and +12 days in Perth.
The rental market has weakened as housing supply has increased
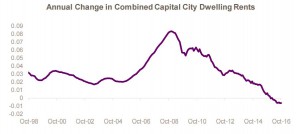
- Combined capital city rental rates have fallen by -0.6% over the 12 months to October 2016 with house rents falling -0.8% and unit rents increasing 0.7%.
- The annual fall in rental rates is the largest on record and has slowed significantly compared to a year ago when rents had increased by 0.6% over the year.
- Across the individual capital cities, rents have increased in Melbourne (+2.5%), Hobart (+6.4%) and Canberra (+4.1%) and are unchanged over the year in Sydney.
- Rental rates have fallen over the past 12 months in Brisbane (-1.1%), Adelaide (-0.1%), Perth (-9.8%) and Darwin (-12.1%).
- Melbourne is the only capital city in which rents are at their historic highs, across the remaining cities the change in rents from their peak are recorded at: -1.4% in Sydney, -2.4% in Brisbane, -2.0% in Adelaide, -19.0% in Perth, -0.1% in Hobart, -24.0% in Darwin and -5.1% in Canberra
With values rising faster than rents, yields are at record low levels
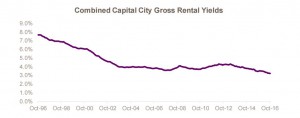
- Gross rental yields across the combined capital cities shifted to a new historic low of 3.2% in October 2016, with house yields recorded at 3.1% and unit yields at 4.1%.
- At the same time a year earlier, rental yields were recorded at 3.5% with houses at 3.4% and units 4.3%.
- Gross rental yields are currently at historic lows of 3.0% in Sydney, 2.9% in Melbourne and 4.0% in Canberra.
- Elsewhere, gross rental yields are recorded at: 4.2% in Brisbane, 4.0% in Adelaide, 3.7% in Perth, 5.3% in Hobart and 4.9% in Darwin.
- Gross rental yields are lower than they were a year ago in all capital cities except for Hobart where they are unchanged.
This is the first of a 4 part series on the Australian housing market’s performance in 2016. Watch out for the next instalment in the next few days.








No comments:
Post a Comment