In this 4 part series we look at the housing market conditions and key economic factors driving housing market conditions across Australia.
The current growth phase for capital city home values commenced in June 2012, almost four and a half years ago, and since that time capital city home values have increased by 42.0%.
To put the geographic differences in growth into perspective, over the current growth phase Sydney home values are 65.9% higher and Melbourne values are up 48.6%, the capital city with the third highest rate of growth was Brisbane where values have increased by a much more modest 19.0% over the period.
Today we look at how interest rates and economic factors affected our markets.
Interest rates remain at historically low levels
- Official interest rates set by the RBA are currently recorded at 1.5%.
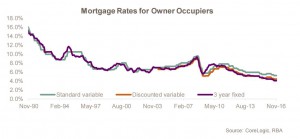
- For an owner occupier, mortgage rates are currently recorded at: 5.25% for a standard variable mortgage, 4.5% for a discounted variable mortgage and 4.0% for a three year fixed rate.
- For investors, current mortgage rates are: 5.5% for a standard variable mortgage, 4.75% for a discounted variable mortgage and 4.15% for a three year fixed mortgage.
- Mortgage premiums for investors have only been in place for just over a year.
- The cost of interest for a mortgage remains at historically low levels.
Household debt is at an historic high, largely due to residential housing
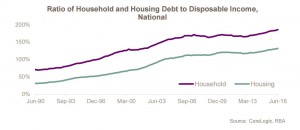
- The national ratio of household debt to disposable income was recorded at 186.0% in June 2016, up from 180.8% a year earlier.
- Of this 180.8% ratio, a record-high 131.5% or 70.7% of the total is debt related to housing. The 131.5% ratio is also at a record high up from 127.8% a year earlier.
- Breaking out the 131.5% ratio of housing debt to disposable income, the RBA reports that 85.2% of the ratio is owner occupier debt leaving 46.3% to investors. The ratio of owner occupier debt has fallen from 92.5% a year earlier while the ratio for investors was at a record high up from 35.3% a year earlier.
- The chart shows that housing and household debt are both at record highs and trending higher. Lower interest rates appear to have encouraged Australian households to take on more debt, particularly housing debt.
While household and housing debt is at record highs the value of these assets relative to household income is at or close to record highs
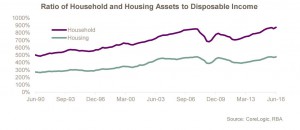
- The RBA also publishes ratios of assets to disposable income which shows a ratio of 873.7% for households and 476.7% for housing.
- The ratio for households is at an historic high having increased from 857.5% in June 2015 and the ratio for housing has risen from 469.0% in June 2015 to 476.7% in June 2016.
- Although households are heavily indebted and hold significant housing debt at a macro level the value of these assets is substantially higher than the debt.
- It is important to note that this data is a national snapshot and includes those households that hold no housing debt.
- The snapshot being national also masks regional trends which may be substantially different to the national figures
Wages are increasing at an historic low rate
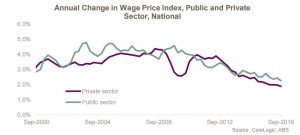
- Over the 12 months to September 2016, the ABS wage price index shows that wages increased by 1.9%.
- Separating the data into private and public sector wages shows that private sector wages increased by 1.9% over the year and private sector wages were 2.3%.
- The ABS has been producing this dataset since late 1997 and the growth in wages for both the private and public sector is at historically low levels.
- Lower wages growth impacts on a household’s ability and willingness to spend more, particularly on items such as rent but it does not appear to be impacting on the growth in housing values.
This is the second of a 4 part series on the Australian housing market’s performance in 2016. Watch out for the next instalment in the next few days.
You may want to read:


No comments:
Post a Comment