In this 4 part series we look at the housing market conditions and key economic factors driving housing market conditions across Australia.
The current growth phase for capital city home values commenced in June 2012, almost four and a half years ago, and since that time capital city home values have increased by 42.0%.
To put the geographic differences in growth into perspective, over the current growth phase Sydney home values are 65.9% higher and Melbourne values are up 48.6%, the capital city with the third highest rate of growth was Brisbane where values have increased by a much more modest 19.0% over the period.
Today we look at how interest rates and the availability of finance affected our markets.
The value of housing finance commitments rose in September 2016
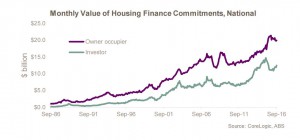
- In September 2016, there was $32.3 billion in housing finance commitments which was the highest monthly value since June 2016.
- The value of housing finance commitments was 2.3% higher over the month and -0.2% lower year-on-year.
- The $32.3 billion consisted of $19.9 billion in lending to owner occupiers and $12.4 billion in lending to investors.
- The $19.9 billion in lending to owner occupiers was 0.9% higher over the month but -5.4% lower year-on-year.
- The $12.4 billion in lending to investors was the highest monthly value since August 2015 and was 4.6% higher over the month and 9.6% higher year-on-year.
Lending to owner occupiers has slowed over recent months and is lower year-on-year
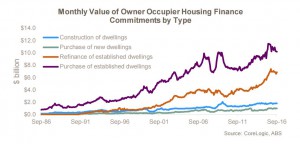
- The $19.9 billion in mortgage lending to owner occupiers in September 2016 consisted of: $1.8 billion for construction of dwellings, $1.0 billion for purchase of new dwellings, $6.9 billion for refinancing of established dwellings and $10.2 billion for purchase of established dwellings.
- Over the month, commitments rose by 0.1% for purchase of new dwellings and by 4.0% for refinances while they fell -1.7% for construction of dwellings and were -0.7% lower for purchase of established dwellings.
- Year-on-year, finance commitments were lower for construction of dwellings (-0.1%), purchase of new dwellings (-3.2%) and purchase of established dwellings (-11.4%) while they were slightly higher (+3.0%) for refinances.
Lending to investors has reignited over recent months 
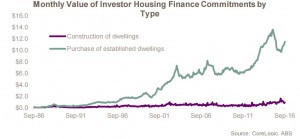
- In September 2016, $0.9 billion was borrowed by investors for construction of dwellings while $11.5 billion was borrowed for established housing.
- Housing finance commitments for established investment housing have increased substantially from $9.8 billion in April 2016 to $11.5 billion in September 2016.
- Over the month of September, commitments for construction of dwellings increased by 11.1% to be 38.8% higher than they were in September 2015.
- The value of finance commitment for established investment properties rose by 4.1% in September 2016 to be 7.9% higher year-on-year.
Owner occupier first home buyer volumes have increased a little but activity remains low
- Data on owner occupier housing finance commitments to first home buyers shows that there were 7,334 commitments to first time buyers in September 2016, accounting for 13.1% of all owner occupier commitments.
- The number of owner occupier first home buyer commitments is -0.5% lower over the month and -7.5% lower over the past 12 months.
- First home buyer participation in the market remains at near historic low levels.
- An increasing number of first home buyers are reportedly purchasing their first property as an investment, unfortunately this data is not published separately and would only be included in the investor data.
Average loan sizes to owner occupiers have fallen over the past year
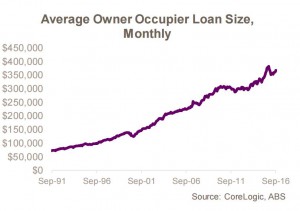
- In September 2016, the average new loan size to owner occupiers was recorded at $367,600.
- The average owner occupier loan size increased by 1.3% over the month but is -2.2% lower than it was a year ago.
- The average owner occupier loan size peaked at $382,300 in November of last year and has since fallen by -3.8%.
- Unfortunately the Australian Bureau of Statistics doesn’t publish a similar dataset for investors.
The majority of owner occupiers take out a variable rate mortgage 
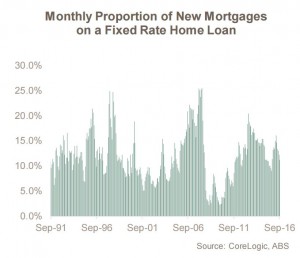
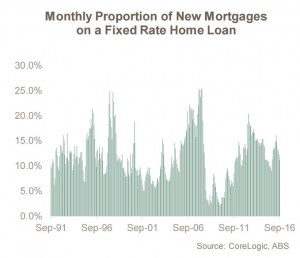
- Housing finance data reveals that in September 2016, only 11.2% of mortgage commitments were for a fixed rate loan meaning 88.8% of mortgages were on a variable rate.
- At its absolute peak, approximately one quarter of mortgages were on a fixed rate.
- Variable rate mortgages are clearly preferred by Australian owner occupiers, again this data is not published for investors.
- The majority of mortgages being on a variable rate means that when the RBA or lenders change interest rates it has an almost immediate impact on household finances.
- Subsequently, changes to monetary policy flow through to the household and are, theoretically at least, more immediate and effective at stimulating or slowing consumer expenditure.
New interest-only lending increased over the June 2016 quarter but is lowerthan recent levels
- According to data from the Australian Prudential Regulation Authority (APRA), $35.575 billion in mortgage lending was for interest-only loans over the June 2016 quarter.
- The value of interest-only lending increased over the quarter from $28.437 billion but is much lower than its peak of $43.982 billion over the June 2015 quarter.
- Interest-only mortgages accounted for 36.2% of the value of all new mortgage lending over the June quarter of 2016, up from 34.9% the previous quarter but much lower than its peak of 45.6% of all new mortgages over the June 2015 quarter.
Average outstanding mortgage balances continue to climb
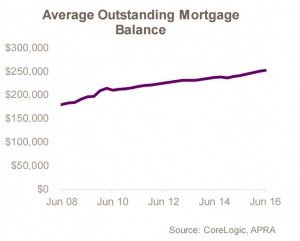
- At the end of the June 2016 quarter, the average outstanding mortgage balance was recorded at $252,100 having increased by 4.5% over the year.
- Mortgages with an offset facility had an average outstanding balance of $308,000 which increased by 4.4% over the year to June 2016.
- Interest-only mortgages had an average outstanding balance of $335,200 having increased by 4.6% over the past year.
- The average outstanding balance on a reverse mortgage has increased by 2.7% over the past year to $97,400.
- Low-documentation mortgages had an average outstanding balance of $191,000 which fell by -1.2% over the past year
- Other non-standard mortgages have seen their average outstanding balances fall by -2.2% to $191,900 over the past year.
Fewer new mortgages are being written with a high loan-to-value ratio (LVR)
- Over the June 2016 quarter, $21.668 billion worth of new mortgage lending was at an LVR above 80% representing 22.0% of all mortgage lending and an historic low.
- $24.641 billion of mortgages over the quarter had an LVR of 60% or less, accounting for 25.0% of all new mortgage lending with the value increasing by 19.2% compared to June 2015.
- More than half (52.9%) of all new mortgages had an LVR of between 60% and 80% with a total value of $52.082 billion having fallen by -1.1% compared to the June quarter 2015.
- $13.467 billion in new mortgages were written over the June 2016 quarter with an LVR of between 80% and 90% which was 6.1% higher than a year earlier and accounted for 13.7% of all new mortgage commitments.
- A record low 8.3% of all new mortgages had an LVR above 90% over the June 2016 quarter with $8.201 billion worth of commitments over the quarter.
- The fall in high LVR lending, which is primarily the result of changed lending regulations from the banking regulator, APRA, which has seen lenders tighten serviceability requirements and take a more conservative lending approach.
- Mortgages with LVRs above 80% also typically incur lenders mortgage insurance (LMI) and a reduction in higher LVR lending means a reduced demand for this product.
Housing credit approaches $1.6 trillion
- The RBA reported that in September 2016, total housing credit was recorded at $1.594 trillion.
- Total housing credit increased by 0.5% in September 2016 with owner occupier credit rising 0.5% and investor credit increasing by 0.6%
- On an annual basis, housing credit has increased by 6.4% with owner occupier credit advancing by 7.3% and investor credit rising by 4.8%.
- The 6.4% annual increase in housing credit is the slowestrate of growth since June 2014.
- Although growth in investor credit is substantially lower over the past year, monthly data shows that it has accelerated over each of the past five months.
You may also want to read:
Part 1- Year End Australian Property Market Review
Part 2 Year End Australian Property Market Review – Population changes
Part 3 Year End Australian Property Market Review – Economic Influences






No comments:
Post a Comment