Capital gains accelerated over the past year, taking the calendar year growth rate to the fastest pace since 2009, according to the December CoreLogic Home Value Index.
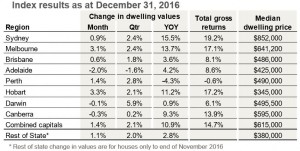
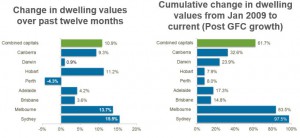
December 2016 saw capital city dwelling values rise by 1.4%, taking the annual capital gain for 2016 to 10.9%; the highest growth rate for a calendar year since 2009.
Factoring in gross rental yields and capital gains, housing as an asset class, earned a total annual return of 14.7% based on the combined capital cities index results.
Across Australia’s capital cities, the annual change in dwelling values for 2016 ranged from -4.3% in Perth to 15.5% in Sydney, with Melbourne and Hobart also showing annual capital gains higher than 10%.
Capital city growth rates have also shown a growing divergence between the broad housing product types.
Over the past twelve months we have seen capital city house values rise by 11.6%, while unit values have increased by roughly half the pace at 5.9%.
The divergence in growth rates is the most distinct in Melbourne and Brisbane, where concerns around unit oversupply have eroded buyer confidence.
Melbourne house values are up 15.1% over the year compared with a 1.7% rise in unit values, while Brisbane housing market values are 4.0% higher over the year, with unit values falling by -0.2%.
Australia’s regional housing markets generally did not experience the same growth conditions as the capital cities, with annual growth to November recorded at 2.8% across the combined regional markets.
Regional New South Wales showed the strongest growth conditions, with non-capital city house values rising 7.3% over the 12 month period to November 2016.
The remaining rest-of-state regions showed relatively sedate conditions, with values rising by half a per cent across regional Victoria, 1% across regional Queensland and 1.1% across regional South Australia.
Regional Western Australia recorded a 7% fall in house values over the year.
Those regional areas with intrinsic ties to the mining and resources sector have continued to record weaker housing market conditions since the end of the mining infrastructure boom, with Perth and Darwin recording the weakest housing market conditions across the capital cities.
Since values peaked in these markets during 2014, values have fallen by a cumulative 7.9% in Perth and 5.9% in Darwin.
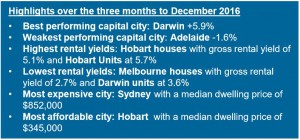
More recently both these markets have shown signs of moving through the low point of their respective downturns, with values rising by 2.8% and 5.9% respectively over the final quarter of 2016.
Based on the annual housing market results, it is clear that housing markets across Australia have responded to regional differences in economic and demographic trends; strong population growth and economic activity have driven value growth in Sydney and Melbourne, however, more recently strong growth trends have spread to Hobart and Canberra, as well as many of the coastal and lifestyle markets where values are now also rising swiftly.
Post Global Financial Crisis, the CoreLogic index results show that Sydney’s dwelling values have almost doubled, rising by 97.5% since January 2009, whilst Melbourne dwelling values have increased by 83.5% over the same time frame.
Every other capital city has seen dwelling values rise at substantially lower rates over this period, highlighting just how strong the Sydney and Melbourne housing market conditions have been over the past 8 years.
Sydney-siders saw dwelling values increase by approximately $10,000 per month over the past year, creating a significant boost in wealth for home owners; at the same time we’ve seen mounting affordability challenges for aspiring home owners.
The recent CoreLogic Housing Affordability Report shows Sydney dwelling prices were 8.3 times higher than annual household incomes and households were dedicating an average of 44.5% of their income to service a mortgage (based on an 80% loan to valuation ratio and the average discounted variable mortgage rate).
The rental yield profile has also deteriorated substantially over the current housing growth cycle, with yields progressively pushing to new record lows over the year.
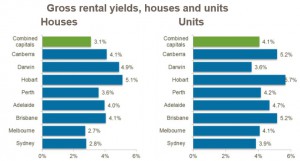
The December results showed the average gross yield for capital city houses was 3.1% and unit yields were tracking at 4.1%.
At the beginning of the current growth cycle, which commenced in June 2012, the yield profile was much healthier, with gross yields averaging 4.2% and 4.8% respectively.
While rental yields have compressed across most of the capitals, the record lows are largely being driving by the Melbourne and Sydney housing markets, where dwelling values have appreciated at a substantially faster rate than rents.
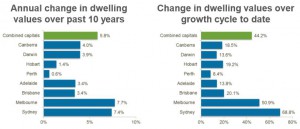
Over the growth cycle to date, Sydney dwelling values are up 69% while rents have increased by approximately 10%; this has caused the gross dwelling yield to fall from 4.5% in June 2012 to the current record low of 3.0%.
Similarly, in Melbourne, dwelling values are 51% higher over the cycle to date, while rents have risen by a much lower 9.6%.
The divergence between dwelling value growth and rental growth has compressed Melbourne’s gross yield profile to a new record low of 2.9% from 3.8% in June 2012.
Considering the trends in value growth remain strong and rental conditions are comparatively sedate, there is a high likelihood that yields may drift even lower during 2017.
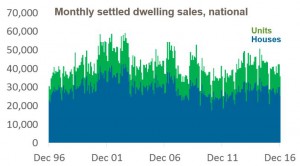
Transaction numbers recorded their normal seasonal fall in December, however comparing CoreLogic estimates of turnover with the same time last year highlights that dwelling sales remain slightly lower than a year ago, despite an upwards trend in activity over the second half of 2016.
Several regions have bucked the trend towards lower home sales, with the number of sales rising compared with last year across the Northern Territory, Australian Capital Territory and South Australia.
CoreLogic estimates that there were approximately 465,500 dwelling sales over the 2016 calendar year, which was 8.7% lower than a year ago and 3.8% lower than the ten year average.
Lower sales aren’t necessarily due to lower housing demand. In most markets, the slowdown in turnover is more attributable to a shortage of stock available for sale rather than a lack of buyer demand.
Low stock levels have fueled a sense of urgency amongst buyers and contributed to short selling times and minimal discounting from vendors.
Looking ahead across 2017, the housing market is likely to face some headwinds that may result in a moderation in growth rates.
Mortgage rates were already trending higher towards the end of 2016, despite any movements in the Reserve Bank cash rate; higher mortgage rates have the potential to quell housing demand, especially considering the record-high levels of household debt which implies consumers are highly sensitive to changes in the cost of debt.
We’re also seeing high levels of supply weighing down the rate of capital gains in the unit sector.
With the peak in unit construction due over the coming year, potentially lower unit valuations relative to the off-the-plan contract price, may cause some disruption to the settlement process.
Additionally, CoreLogic noted that regulators may consider implementing policies aimed at reducing investment activity in the housing market.
Based on ABS housing finance data, investors have been progressively increasing their share of mortgage demand since the May and August rate cuts last year.
The latest data shows investors now comprise 49% of mortgage demand, excluding refinanced loans.
With rental yields at record lows, it is logical to assume investors are largely speculating on future capital gains in dwelling values and disregarding the low yield profile.
If housing market investment activity does reduce, it has the potential to mitigate some of the upwards pressure on home values.
Organic factors may also contribute to a reduction in buyer demand and growth rates such as fewer buyers who can afford high housing prices, particularly in Sydney and Melbourne where values have increased substantially more than in other cities.
Consumer confidence may also affect buyer demand.
There is a high correlation between consumer confidence and housing turnover; so if confidence measures continue to track lower we can expect consumers to be less willing to make high commitment decisions such as purchasing a property.
While we expect 2017 dwelling values to rise at a lower rate than in 2016, there is still potential for further growth across Australia’s housing market.
Smaller capital cities such as Canberra and Hobart have demonstrated an accelerating growth trend and recent CoreLogic data suggests that Darwin and Perth may be approaching, or moving through the bottom of the downturn.
Lifestyle markets are also becoming more popular as tourism improves and home owners look to leverage their new found equity.





No comments:
Post a Comment