Treasurer Scott Morrison recently came out in the press all guns blazing regarding Home Ownership Affordability – and he made a valid point.
Recent statistics show that only 8% of new mortgages relate to first home buyers which is a sharp decline of 40% over 5 years suggesting that first home buyers are finding it increasingly difficult to buy their first home.
Now, many are calling for a scrapping of stamp duty for first home buyers as a measure to help first home buyers get into the market.
The opposition fired back saying policies need to change to make home ownership more affordable, including opening up the old chestnut negative gearing and Capital gains tax..
But is property just being used as a political football, or has home ownership really gone beyond the average Australian?
A closer look at the FACTS exposes the ‘Home Ownership Affordability Myth’.
My research shows that it is certainly more difficult today to accumulate a deposit to acquire a property, however it also shows that a mortgage is no more or less affordable than three decades ago.
Being an Accountant, I wanted to look at the numbers to assess the facts for myself rather than listen to rhetoric.
In so doing, I have reviewed various data drawing comparisons on both Houses and Apartments over the last forty years and have focused on the Sydney market by way of an example.
I took Sydney as my sample because Sydney would be the worst case scenario as Sydney median prices are the highest in the country.
However, if you did a similar comparison with the other capitals around the country the numbers will be better than shown in my spread sheet below due to lower median values.
My sources:
- Australian Taxation Office (average annual adult salaries and historic tax rates), Reserve Bank of Australia (Interest Rate History),
- Australian Bureau of statistics (Median House prices and incomes)
- Various Financial institutions (Mortgage calculations).
My Approach:
- I have looked at the median Housing and apartment price in the year and the interest rate applicable as at 31st December of that same year.
- I have then worked through what the Repayments would be based on a principle and Interest loan over a standard 30-year mortgage.
My Assumptions:
- My assumptions are we have Borrowed 80% of the median Price of the property on a standard 30 Year Principle and interest loan.
- Furthermore, I have also calculated what the disposable income after Tax on the average adult annual salary would be for that year, to give me the true picture of affordability.
I analysed the data with the above in mind… The findings are quite interesting.
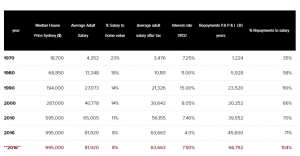
Home Ownership Affordability (HOUSES) in Sydney since 1970.
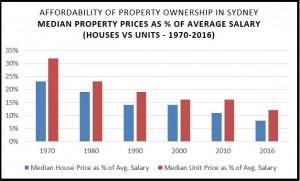
As you can see from the below table our average annual salaries as a percentage to the prices of property have decreased from 23% in 1970, down to 8 % in 2016. Whereas Apartments have dropped from 32% to 12% over the 46 years.
The big question is how do first home buyers enter the market today, the first one being the ability to raise the 20% deposit on the median price property (apartment or house) and pay associated costs including stamp duty – let’s assume 5%.
It is clear that in quantum 25% of the median house price in 1970 being $18,700 x 25% = $4,675 (approx. 1 years’ salary) is a lot less than that of today 2016 $995,000 x 25% = $248,000 (approx. 3 years’ salary) so that means its three times more difficult today than 40 years ago to save for a deposit.
This is the real issue and the reason why government’s need to focus on relief to first home buyers in associated costs like stamp duty to enter the market.
But is it costing us any more to fund our Mortgage today in comparison to decades before?
To determine this, I worked with disposable income of the average adult for that year (after tax).
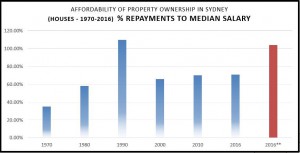
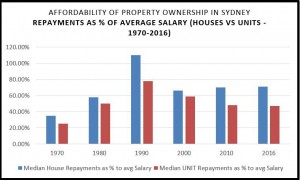
In 1970 it cost us 35% of our annual salary to fund the mortgage of a median house in Sydney compared to 71% today, if you look back at 1980, 58% of our annual salary ,1990 110% of our annual salary, 2000 66% of our annual salary 2010 70% of our annual salary to fund the mortgage.
So there has been little movement upwards over the last 3 decades.
It’s all predicated on the price of borrowings (interest rates).
In the 80s with Interest rates at all-time highs it was near impossible to fund a mortgage on the average wage at the time at 110% of the average annual salary, but since then around the 70% mark.
The real concern based on this research is what would happen if Interest rates increased?
**I note that as an average interest rate over the last 50 years is approx. 7.5%, if Australia’s interest rate drifted out to 7.5 % affordability becomes a real issue and it would require 104% of average adult salary to fund the standard 30-year Principle and interest mortgage.
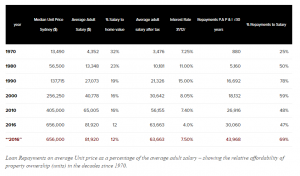
Home Ownership Affordability (UNITS) in Sydney between 1970 and 2016.
Now let’s look at units/apartments over the same period, this explains the reasoning behind government policy on median density and the focus on this style of development as they really have no choice.
If you look at the spreadsheet and history of apartment prices, it’s much more affordable for the average Australian to purchase an apartment than a house.
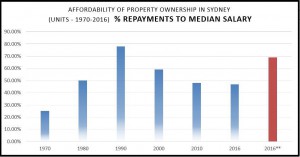
this graph emphasis my point and in a previous newsletter article that our major cities especially Sydney, Melbourne and Brisbane will end up like the London’s and New York’s with high density inner city apartment living being the norm.
Table: Home Ownership Affordability (Apartments/Units) in Sydney since 1970
Although there has been increase in apartment values over the same period the affordability has been consistent and in fact it is more affordable to fund a mortgage on an apartment today than it was nearly 40 years ago.
In 1980 it would cost you 50% of your after tax salary to cover the mortgage; whereas in 2016 it is 47% of your annual salary, even if interest rates drifted back to the average of 7.5% it would increase to 69% of the average adult salary.
GRAPH: Comparing both Median House Prices & Apartment/UNIT prices as a percentage of the average adult salary since 1970.
GRAPH: Comparing the average Loan Repayments for Houses and UNITS as a percentage of the average adult salary since 1970.
There is no one solution to this problem and it will require a multi-pronged attack, some ideas being making it easier for property developers to build more affordable housing, relief of the onerous entry costs like stamp duty for first home buyers, managing interest rates and inflation so property prices don’t get out of hand and many others.
I would encourage the government to look outside the box and consider the option for first Home buyers to use their superannuation savings as a one off to assist with the deposit on their first home, also consider the ability for first home buyers to access their Super contribution levies to assist with mortgage payments for say the first 5 years of ownership.
Whatever the argument Home Ownership Affordability is a real issue today, but let’s not get caught up in the politics, as it has proven to have been an issue for many decades and governments have done little over this time to alleviate the problems.
The most pressing challenge for the government at present is maintaining low interest rates as any rise in the cost of funding will make matters worse and have an immediate impact on the housing market.



No comments:
Post a Comment