Capital city dwelling values rose a further 1.4% in February, with Sydney continuing as the overall capital gains leader.
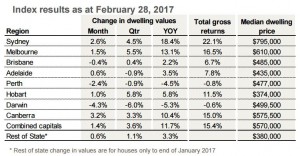
The monthly CoreLogic Hedonic Home Value Index reported a further rise in the value of capital city dwellings in February, with values rising 1.4% over the month.
The strong capital gain over February was led by Canberra (+3.2%) and Sydney (+2.6%), with Melbourne (+1.5%) and Hobart (+1.0%) also returning significant increases.
In contrast, dwelling values were down over the month across Darwin (-4.3%), Perth (-2.4%) and Brisbane (-0.4%).
Growth conditions have accelerated since mid-2016 CoreLogic head of research.
At a combined capital city level, growth conditions have been rebounding since the middle of last year when, on two separate occasions, interest rates were cut, and investor demand commenced trending higher.
Prior to capital gains accelerating half way through last year, the growth trend had been moderating, reaching a cyclical low point over the twelve months ended July 2016 when the annual change in capital city dwelling values slowed to 6.1%.
A new cyclical high for annual growth rate.
The February results mark a new high point in the current growth cycle, with capital city dwelling values increasing by 11.7% over the past twelve months.
The annual growth rate across the combined capitals hasn’t been this strong since the twelve months ending June 2010.
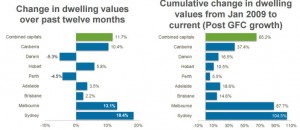
In Sydney, where the annual rate of growth is now 18.4%, this is the highest annual growth rate since the twelve months ending December 2002 when the housing boom of the early 2000’s started to slow.
The current growth cycle is approaching 5 years in duration.
The latest CoreLogic results take the current housing growth cycle into its 58th month.
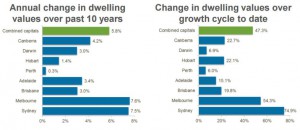
Since capital city dwelling values started to rise in June 2012, dwelling values have increased by a cumulative 47.3%, ranging from a 74.9% capital gain in Sydney, to a net rise of 6.0% in Perth.
Sydney, and to a lesser extent, Melbourne, have remained at the top of the capital gain tables over the past two cycles.
Since the beginning of 2009, Sydney dwelling values have more than doubled, rising by 104.5% while in the Melbourne housing market values are 87.7% higher.
The next best performing capital city over the same period was Canberra where dwelling values have risen by a comparatively modest 37.4%.
High capital gains: good news for home owners but a growing challenge for prospective buyers.
The strong growth conditions across Sydney have provided a substantial wealth boost for home owners, however, the flipside is that housing costs are becoming increasingly out of reach.
This is especially true for price-sensitive segments of the market such as first time buyers and low income families.
Affordability challenges are most pronounced across the Sydney housing market where, based on September 2016 data, dwelling prices are almost 8.5 times higher than gross household incomes.
The second most expensive capital city, Melbourne, has a dwelling price to income ratio of 7.1.
Strong headline results mask weak housing market conditions in some areas. 
In contrast, the February results show that the cities with greater exposure to the mining downturn have continued to record weak housing market results.
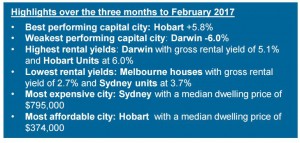
Dwelling values slipped lower in Perth and Darwin over the month, taking the cumulative decline in values since these markets peaked in 2014 to 10.0% and 11.5% respectively.
The Brisbane property market also recorded a fall in dwelling values over the month, however values have been slowly trending higher despite the negative monthly result.
As a consequence, housing affordability has shown a marked improvement in these regions, with the dwelling price to income ratio tracking at 5.7 in Brisbane, 5.5 in Perth and 4.5 in Darwin based on September 2016 data.
Rental markets remain soft which is resulting in rental yields slipping to new record lows.
While dwelling values continued to rise, weekly rents remained comparatively soft.
As a result, downward pressure has been placed on rental yields.
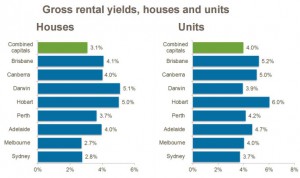
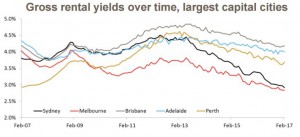
The average dwelling yield across the combined capital cities fell to 3.2% over the month, which is a new record low.
Five years ago, the average capital city yield was a full percentage point higher at 4.2%.
Sydney has shown the most significant compression in rental yields over the past five years, with the average gross yield reducing by 150 basis points to reach 2.9% (2.7% for houses and 3.7% for units).
Despite low yields, investors remain a large component of market demand.
Despite the record low rental yields on offer, investor demand remains high, suggesting investors are likely to be relying on a negative gearing strategy to compensate for their cash flow losses.
It also indicates that investors are speculating on future capital gains.
The latest housing finance data from the Australian Bureau of Statistics indicates that investors comprise approximately 57% of new mortgage demand across New South Wales (excluding refinanced loans).
This is substantially higher than the long run average, which is slightly above one third.
Many factors corroborate the strong growth conditions and regional diversity.
The renewed strength in the housing market is corroborated by a range of other data points such as auction results, low advertised stock levels and rapid selling times.
According to CoreLogic auction results, 2017 began on a very strong footing with capital city clearance rates generally tracking in the high 70% to mid-80% range from week to week.
The results of ‘Super Saturday’ last week saw an unprecedented number of auctions for February; clearance rates reached a new high for 2017 despite the large number of auctions held.
Advertised listing numbers remain low across the hottest housing markets, with total residential advertised listings in Sydney tracking 11.3% lower than the same period a year ago, Melbourne total listings are 5.1% lower than last year, Hobart listings are down by 35% and Canberra advertised stock levels are 6.2% lower than a year ago.
Low levels of advertised stock for sale at a time when buyer demand remains strong is creating a sense of urgency among buyers, which is adding to the upward pressure on prices.
This helps to explain why clearance rates are so high, and private treaty sales are so rapid across the strongest markets.
Strong growth conditions are likely to moderate later this year.
Overall, the latest results from the CoreLogic Hedonic Index highlights the performance diversity across Australia’s housing market.
The continuation of the capital gains rebound is likely to create further discomfort among policy makers, particularly in light of the growing debate around affordability and the high level of demand from investors.
I remain of the view that housing market conditions will moderate during 2017 due to affordability constraints impacting on housing demand, as well as higher supply levels and an eventual slowing of investment demand brought about either through changed policies from Australian lenders or via regulatory changes aimed at slowing credit growth across the investment sector.






No comments:
Post a Comment