With New South Wales and Victoria home to two of Australia’s best performing capital cities property markets, Sydney and Melbourne, it’s not surprising that mortgage demand in both areas is now the highest in the country.
As a result, dwelling values are being driven higher across these two cities compared with other regions.
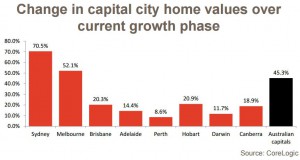
The current housing market growth phase has really been all about Sydney and Melbourne.
We’ve seen dwelling value growth increase substantially higher in Sydney and Melbourne than in any other of the capitals.
As can be seen in today’s accompanying charts, the change in capital city dwelling values over the current growth phase began to take off in June 2012.
Over this period, only Sydney and Melbourne recorded value rises greater than 21%.

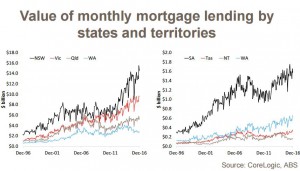
Looking at mortgage finance across the states and territories, in December 2016 the value of mortgage lending across each state and territory was recorded at: $14.5 billion in NSW, $9.6 billion in Vic, $5.1 billion in Qld, $1.6 billion in SA, $2.7 billion in WA, $0.3 billion in Tas, $0.2 billion in NT and $0.7 billion in ACT.
Over the month, NSW (41.8%) and Vic (27.7%) accounted for a combined 69.5% of the value of all housing finance commitments which was an historic high.
In June 2012 when the current growth phase commenced, 33.6% of housing finance commitments was in NSW and 27.1% were in Vic.
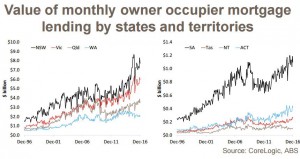
The value of housing finance commitments for owner occupier housing in December 2016 across the states and territories were recorded at: $7.7 billion in NSW, $6.0 billion in Vic, $3.5 billion in Qld, $1.1 billion in SA, $2.0 billion in WA, $0.3 billion in Tas, $0.1 billion NT and $0.4 billion in ACT.
Since the current value growth phase commenced in June 2012, monthly mortgage lending to owner occupiers has increased from $4.3 billion in NSW and $3.9 billion in Vic.
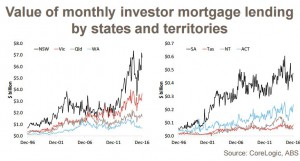
In December 2016, the value of mortgage lending to investors across the states and territories was recorded at: $6.8 billion in NSW, $3.7 billion in Vic, $1.7 billion in Qld, $0.5 billion in SA, $0.7 billion in WA, $0.1 billion in Tas, $0.1 billion in NT and $0.2 billion in ACT.
More than three quarters (76.3%) of investor mortgage finance nationally in December 2016 was in NSW (49.6%) or Vic (26.7%).
While the proportion of lending to investors has previously been higher in each state, combined they make up the largest share on record.
At the beginning of the current growth phase, 37.3% of national investor finance commitments were in NSW and 25.1% was in NSW.
With the demand focused so much on New South Wales and Victoria, it’s not surprising values in Sydney and Melbourne have increased so much more than in the other capital cities.
While steps have been implemented to cool mortgage demand, particularly from investors in Sydney and Melbourne, the data points to the fact that demand is unquestionably, very strong.
Clearly with interest rates remaining at close to historic lows, further changes will be required in order to slow mortgage demand and dampen the increases in dwelling values being experienced in Sydney and Melbourne.


No comments:
Post a Comment