Want to know which suburbs will exhibit the best capital growth in the future?
You know how they say “the best indicator of future performance is past performance.” 
Now that’s not always correct, but obviously the longer a suburb has outperformed the more likely it will continue to at least perform well and at best remain a star performer.
So let’s look at the top 100 long term hot spots
In Aussie’s 25 year property trend report CoreLogic has identified the best performing suburbs for price growth over the past twenty five years, based on change in median prices between 1993 and 2018.
Some interesting trends emerged:-
- 81% of the top 100 long term (last 25 years) growth suburbs around Australia were located in a capital city.
- 41% were located in Melbourne.
- 25% were located in Sydney.
Now I now that currently some “commentators” and buyers agents are recommending chasing the next so called “property hot spot.”
You know…buy in Hobart it’s so cheap and pretty.
Or buy in regional Australia – not everyone wants to live in a capital city.
But why fight the big, long term trends
The Aussie report shows that the Melbourne property market has led the long term year growth rate around Australia with overall median house prices rising by 8.1% over the past twenty five years.
During the same time period Sydney prices rose 7.6% higher per annum on average and Perth prices were up 6.7% per annum.
You may also want to read: Here’s why Melbourne and Sydney have decoupled from the rest of Australia’s property markets.
Here’s an extract of the Aussie report:
The fact that Melbourne and Sydney suburbs have dominated the list will come as no surprise to many, especially considering the dramatic capital gains seen over the past two growth cycles.
Suburbs of Perth, however, are a bit more surprising, considering dwelling values have been tracking lower since 2014.
It’s important to remember that prior to the mining downturn, Perth was one of the hottest markets in Australia with dwelling values substantially outperforming the broader market between 2003 and 2013.
Despite the two largest capital cities comprising the large majority of suburbs within the Top 100, nine of the top ten suburbs were actually located within regional markets.
Byron’s Suffolk Park topped the list, with the median house price moving from just $74,250 twenty five years ago to $1,185,000 in 2018; an increase of 11.7% per annum.
Coastal and lifestyle markets around the South West of Western Australia and the Hunter region of New South Wales were amongst the strongest performers across the regional markets, comprising 6 suburbs and 4 suburbs respectively across the Top 100 list of highest growth in median prices.
Houses were the primary growth driver.
Another perspective on the Top 100 list was the fact that detached houses were the primary growth driver; in fact not a single suburb level unit market made it onto the national Top 100 list for price growth over the past twenty five years. 
The best performing suburb for unit price growth over the past twenty five years was Sydney’s Willoughby (+9.4% per annum), which ranked number 131 nationally.
The absence of unit markets from the Top 100 list suggests the underlying land value has been the key driver of the best performers.
Overall the Top 100 shows a dramatic range in top performing areas, highlighting both the diversity in housing stock around the country as well as the different cycles of growth seen over the past twenty five years.
No doubt that next twenty five years will show an equally diverse result when we examine a fresh set of data.
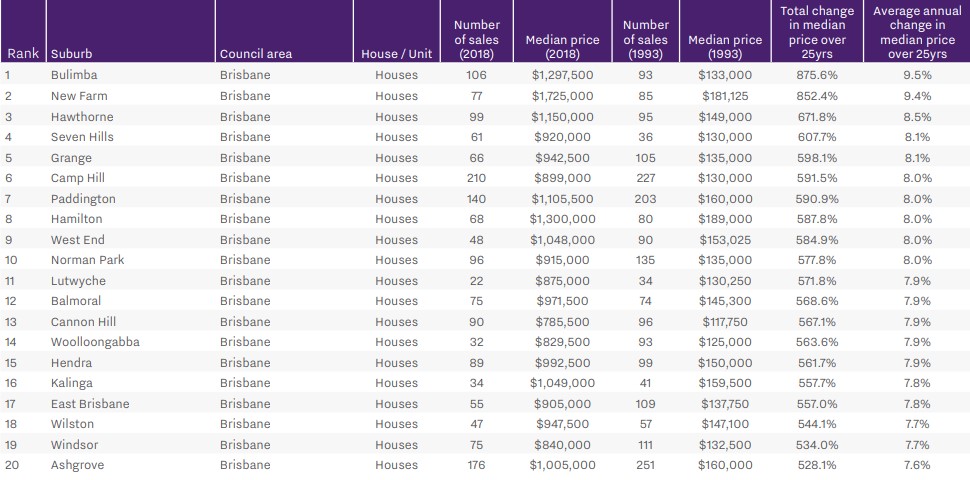
Top 20 tables for Australia’s capital cities and largest regions
Sydney, NSW

Melbourne, Vic

Brisbane, Qld

Perth, WA

No comments:
Post a Comment