Over the second quarter of 2018, national dwelling values have declined by-0.5%, matching the -0.5% fall in values over the March quarter.
Throughout the 12months to June2018, national dwelling values have declined by-0.8%. 
Althougha -0.8% fall isn’t overly large, it is the greatest annual fall in values since September 2012 when values had fallen-1.1% over the year.
While the headline figure is recording falls largely due to declines in Sydney and Melbourne dwelling values, housing market conditions have also softened in most other capital cities.
In fact, Brisbane, Adelaide and Hobart are the only capital cities where dwelling values remain at peak levels.
In Perth and Darwin, values have been below their peak since 2014, while markets such as Sydney, Melbourne and Canberra have also entered a downturn.
Even in Brisbane and Adelaide, where the pace of capital gains has been relatively sustainable, the rate of value growth has slowed over the past 12 months.
Slow growth in dwelling values continues across Qld
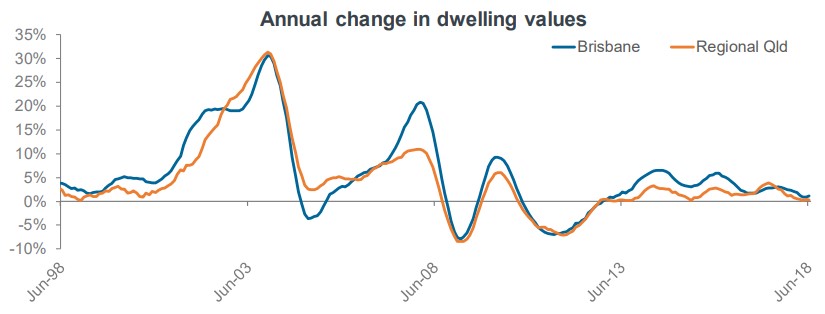
Over the second quarter of 2018, Brisbane dwelling values increased by 0.3% while across regional Qld values fell by -0.2%.
Brisbane dwelling values increased by 1.1% over the 2017-18 financial year while in regional Qld values increased by a slower 0.3%.
Annual value growth in each of Brisbane and regional Qld has slowed from a year ago and while values continue to rise it is at a very slow pace.
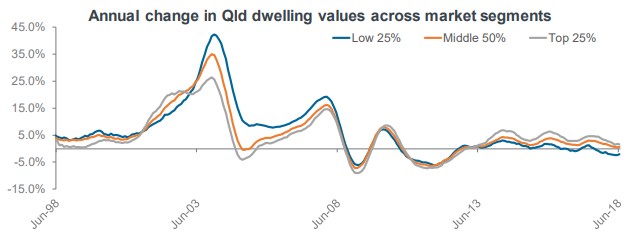
The most affordable properties in Qld have recorded values fall over the past year while more expensive stock is seeing values rise

Dwelling values across the 25% of most affordable housing stock in Qld has fallen by -2.0% over the past year compared to a 0.6% increase across the middle 50% of housing stock and a 1.7% increase across the most expensive 25% of housing stock.
In Brisbane, values have increased by 0.9% over the past year across both the most affordable and the most expensive 25% of properties in the city and they have increased by 1.2% across the middle 50% of the market.
Regional Qld dwelling values have fallen by -3.1% across the most affordable 25% of properties over the past year, are -0.8% lower across the middle 50% of properties and have increased by 2.2% across the most expensive 25% of properties.
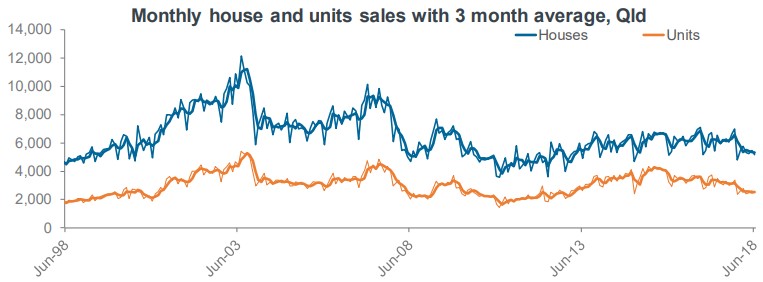
Transaction volumes are substantially lower over the past year
There were 23,513 dwellings sales across Qld over the three months to June 2018 which was -14.4% fewer than the same period in 2017.
The number of settled sales in Brisbane was – 16.0% lower over the past three months compared to the same period in 2017 with 11,068 sales.
There were 12,445 house and unit sales in regional Qld over the three months to June 2018 which was -12.9% lower than the number over the second quarter of 2017.
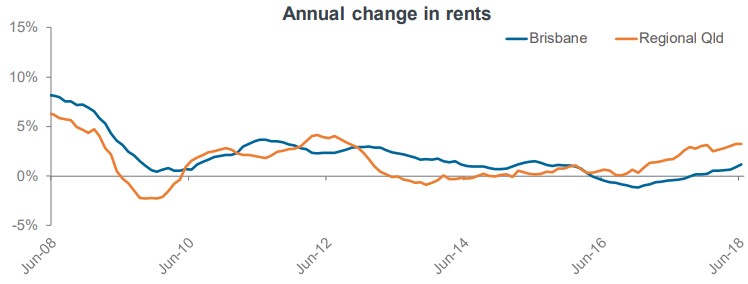
Rental growth has accelerated across the state over the past year
In Brisbane, rental rates increased by 0.3% over the three months to June 2018 while rents increased by 0.6% over the same period in regional Qld.
Rental growth in Brisbane has accelerated over the past year from a -0.4% annual decline a year ago to a 1.2% increase over the past year, the largest annual increase since July 2015.
In regional Qld, rents have increased by 3.3% over the past year, their fastest rate of growth since September 2012.
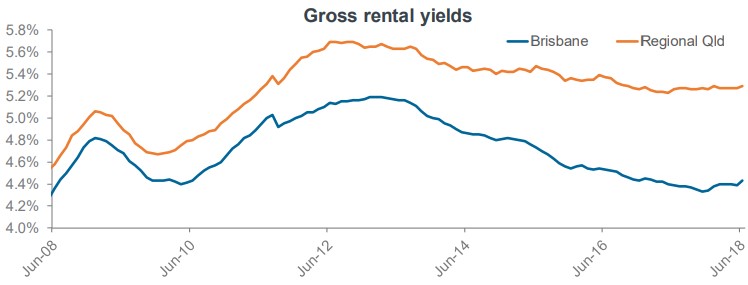
Rental yields have increased slightly over the past year
Gross rental yields in Brisbane have increased from 4.39% in June 2017 to 4.43% currently.
In regional Qld, gross rental yields are currently recorded at 5.29%, up from 5.26% a year ago.
Growth in state final demand in Qld has slowed over the past year
State final demand measures the total value of goods and services that are sold in a state to buyers who wish to either consume them or retain them in the form of capital assets.
It excludes sales made to buyers who use them as inputs to a production activity, export sales and sales that lead to accumulation of inventories.
Given it excludes exports and inventories it isn’t directly comparable to GDP.
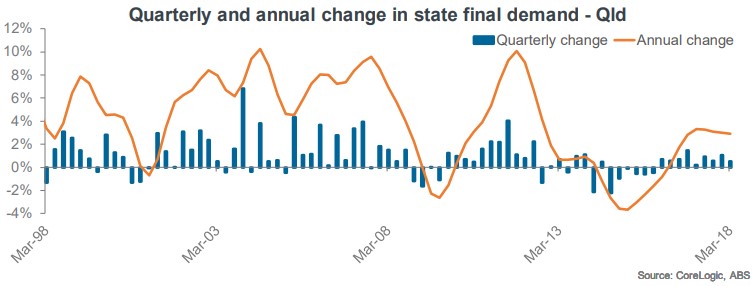
Over the March 2018 quarter, state final demand in Qld has increased by 0.5% which was down from 1.1% the previous quarter and up from 0.2% the previous year.
State final demand increased by 2.9% over the past year its slowest annual growth since December 2016.
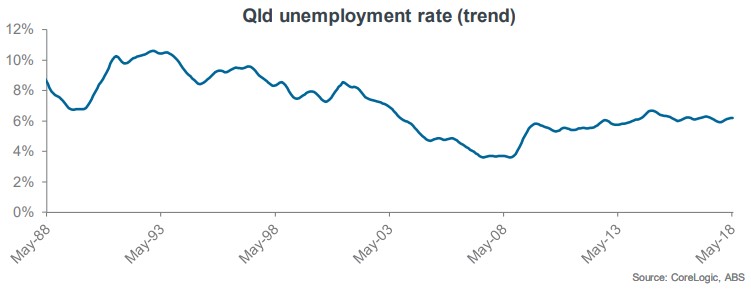
Qld’s job creation is quite strong but the unemployment rate remains stubbornly high
The trend unemployment rate in Qld was reported at 6.1% in June 2018, slightly higher than the 6.0% recorded a year earlier.
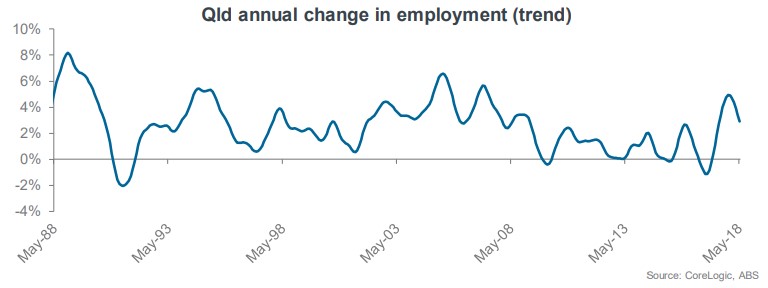
Over the past 12 months, Qld has created 62,739 jobs.
Based on 62,739 jobs created over the past year, total employment has increased by 2.6% which has accounted for 19.6% of all jobs created nationally.
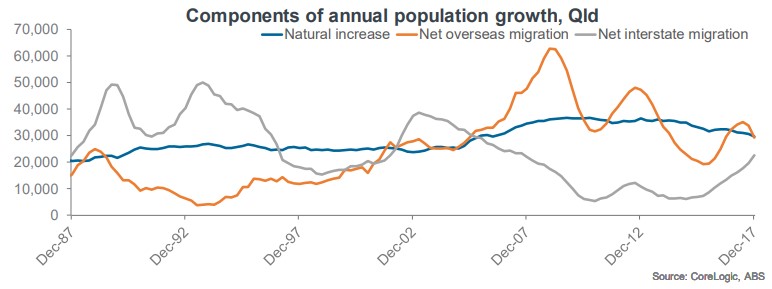
Qld has led the nation in net interstate migration over the past year
The population of Qld increased by 81,461 persons over the 12 months to December 2017 with Qld accounting for 21.0% of the nation’s population growth over the year.
The 81,461 person increase in population was split between: natural increase of 29,602 persons, net overseas migration of 29,349 persons and net interstate migration of 22,510 persons.
Over the year, natural increase was the lowest it’s been since June 2006, net overseas migration was the lowest it’s been since June 2016 and net interstate migration has increased for 12 consecutive quarters and is at its highest level since September 2007.
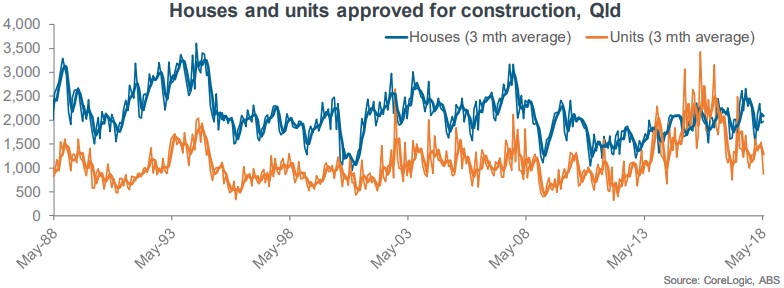
Dwelling approvals are falling across Qld
There were 2,840 dwellings approved for construction across the state in May 2018 which was -18.3% fewer over the month and a decline of – 24.6% year-on-year.
There were 1,971 houses and 869 units approved for construction over the month.
House approvals in May were 1.8% higher over the month but -16.1% lower year-on-year while unit approvals were -43.6% lower over the month and – 38.7% lower year-on-year.
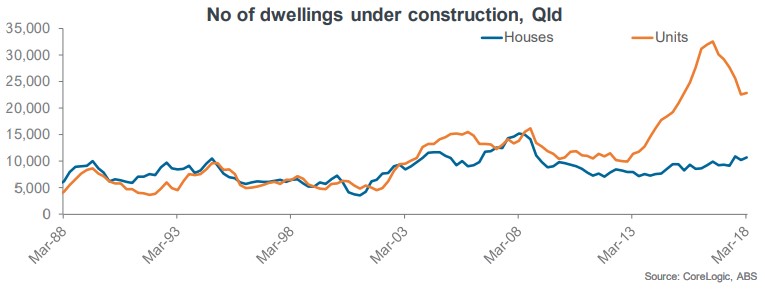
The number of dwellings under construction increased over the quarter
At the end of March 2018 there were 33,813 dwellings under construction in Qld which was 2.6% more than at the end of 2017.
The 33,813 dwellings under construction was split between: 10,734 new houses, 22,905 new units and 174 non-new dwellings.
The number of new houses under construction was the highest it has been since December 2008 while the number of units under construction was slightly higher than the previous quarter.
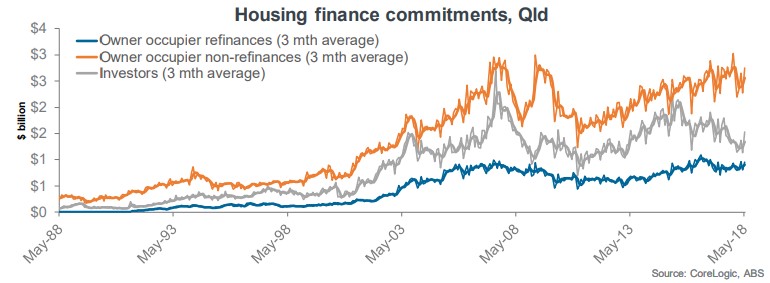
The value of housing finance commitments showed a substantial rise over the month
In May 2018 there was $5.2 billion worth of housing finance commitments in Qld which was 24.1% higher over the month but -1.7% lower year-onyear.
The $5.2 billion in housing finance commitments was split between: $1.0 billion for owner occupier refinances, $2.7 billion for owner occupier new lending and $1.5 billion to investors.
Each segment of lending recorded an increase over the month however, owner occupier new lending and investor lending was lower than it was a year earlier.

No comments:
Post a Comment