Over the second quarter of 2018, national dwelling values have declined by-0.5%, matching the -0.5% fall in values over the March quarter.
Throughout the 12months to June2018, national dwelling values have declined by-0.8%. 
Althougha -0.8% fall isn’t overly large, it is the greatest annual fall in values since September 2012 when values had fallen-1.1% over the year.
While the headline figure is recording falls largely due to declines in Sydney and Melbourne dwelling values, housing market conditions have also softened in most other capital cities.
In fact, Brisbane, Adelaide and Hobart are the only capital cities where dwelling values remain at peak levels.
In Perth and Darwin, values have been below their peak since 2014, while markets such as Sydney, Melbourne and Canberra have also entered a downturn.
Even in Brisbane and Adelaide, where the pace of capital gains has been relatively sustainable, the rate of value growth has slowed over the past 12 months.
Dwelling values are increasing at their slowest annual pace since January 2013
Melbourne dwelling values fell by -1.4% over the second quarter of 2018 which was their largest quarterly fall since February 2012 and regional Vic values increase by 1.8%.
Over the 2017-18 financial year, Melbourne dwelling values increase by 1.0%, their slowest annual rate of growth since January 2013, while in regional Vic values increased by 5.0%, their fastest annual rate of growth since September 2017.
Although value growth has slowed rapidly over the past year in Melbourne, regional Vic continues to see comparatively stronger growth, driven by housing being much more affordable than it is in Melbourne.

Values falls are confined to the upper quartile of the market
Over the past year, dwelling values for the most affordable 25% of Vic housing stock has increased by 4.5% while the middle 50% of housing stock has increased 5.0% and the most expensive 25% has recorded a decline of -1.7%.

In Melbourne, the most affordable 25% of properties have increased in value by 9.3% over the past year compared to a 3.3% increase across the middle 50% of the market and a -2.5% fall across the 25% of most expensive properties.
Regional Vic dwelling values have increased 4.5% across the most affordable 25% of properties over the past year, are 5.0% higher across the middle 50% of properties and have increased by 5.6% across the most expensive 25% of properties.

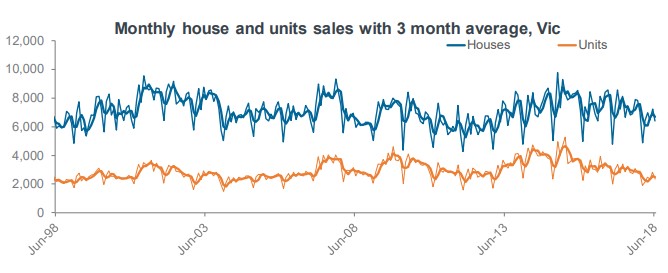
There’s been a significant fall in sales transactions over the past 12 months
Over the past three months there was 27,630 house and unit settlements in Vic which was – 11.1% lower than over the same three month period last year.
In Melbourne, there were 20,247 transactions settled over the three months to June 2018 which was -14.1% lower than the same period in 2017.
There were 7,383 house and unit settlements in regional Vic over the three months to June 2018 which was -1.8% lower than the number over the second quarter of 2017.
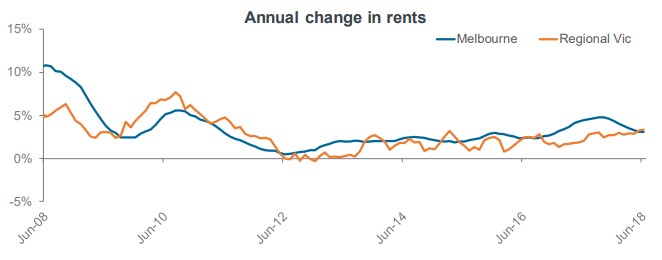
Rental growth has accelerated in regional Vic while it has slowed in Melbourne
Over the second quarter of 2018, Melbourne rents fell by 0.9% while they increased by 0.7% over the period in regional Vic.
Throughout the past year, Melbourne rental growth has slowed from 4.4% to 3.1% and in regional Vic annual rental growth was 2.1% a year ago and has increased to 3.4% over the past year.
Both Melbourne and regional Vic are seeing rental rates continue to rise however, there is a clear slowing of rental growth in Melbourne and an acceleration in regional Vic.
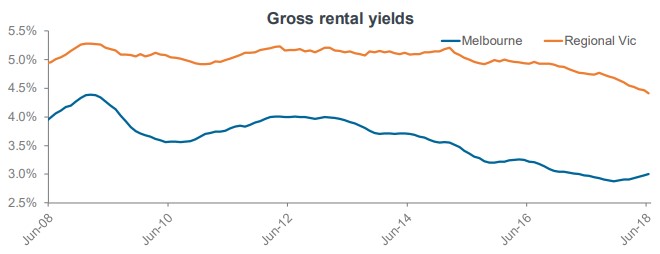
In Melbourne, gross rental yields are slowly rising from their historic lows
Gross rental yields in Melbourne were recorded at 3.00% in June 2018, up from 2.97% a year earlier.
Regional Vic gross rental yields have fallen from 4.75% in June 2017 to 4.41% in June 2018.
Growth in state final demand for Vic over the June 2018 quarter was the strongest in a number of years
State final demand measures the total value of goods and services that are sold in a state to buyers who wish to either consume them or retain them in the form of capital assets.
It excludes sales made to buyers who use them as inputs to a production activity, export sales and sales that lead to accumulation of inventories.
Given it excludes exports and inventories it isn’t directly comparable to GDP.

State final demand in Vic increased by 1.9% over the March 2018 quarter which was the strongest quarterly increase since a 2.3% increase in March 2013.
Over the past 12 months, Vic state final demand has increased by 4.9% which was the greatest growth of all states and territories.
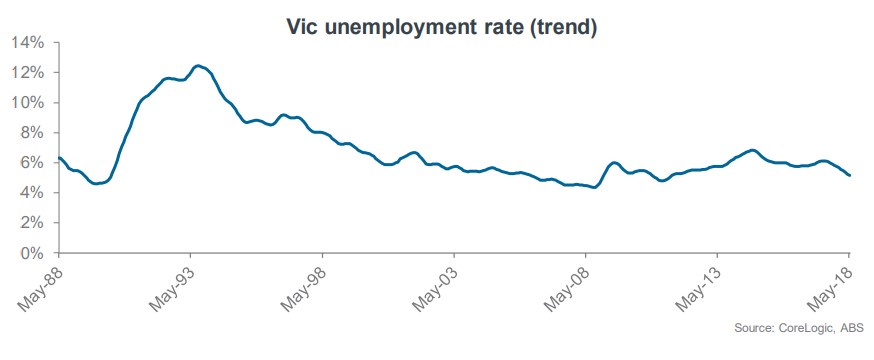
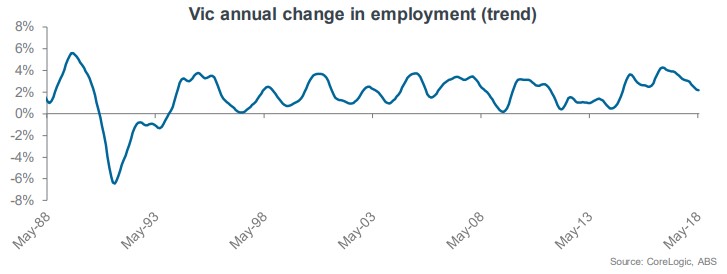
The unemployment rate in Vic has fallen substantially over the past year
Vic’s trend unemployment rate was recorded at 5.5% in June 2018 which was down from 6.1% a year earlier.
Vic has created 64,000 jobs over the 12 months to June 2018.
Based on the 64,000 jobs created over the past year, total employment has increased by 2.0% and 20.0% of all jobs created nationally last year were in Vic.
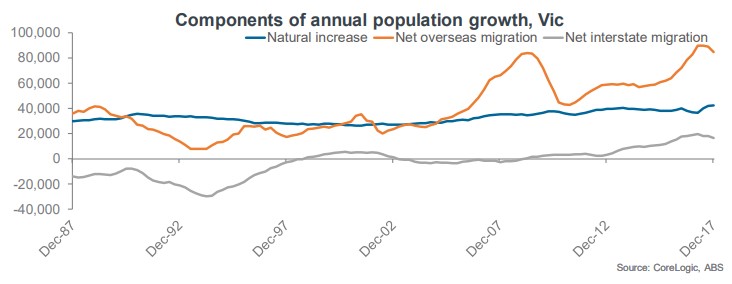
Vic remains the nation’s population growth powerhouse but growth has started to slow
 Vic’s population increased by 143,420 persons over the 2017 calendar year which was the state’s smallest increase in population since December 2015 however, it still accounted for 37.0% of the nation’s population increase
Looking at the components, the 143,420 person population increase was comprised of 42,312 from natural increase, 84,722 persons from net overseas migration and 16,386 persons from net interstate migration.
While natural increase was at an historic high level, net overseas migration was the lowest it’s been since September 2016 and net interstate migration has been falling for three consecutive quarters and is the lowest it’s been since March 2016.
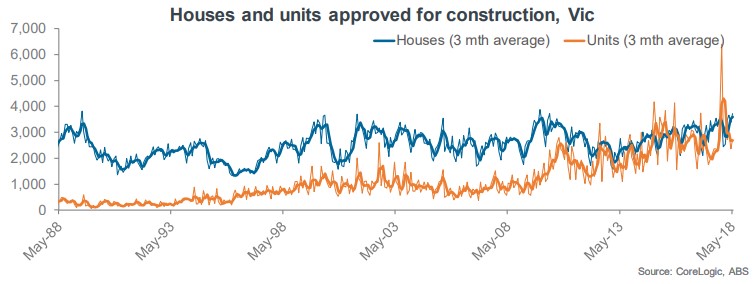
While unit approvals are well down from their peak, house approvals are climbing
In May 2018, there were 6,435 dwellings approved for construction in Vic which was 11.8% higher over the month and 18.3% higher year-on-year.
Over the month there were 3,714 houses approved for construction, an increase of 9.7% over the month and a 7.9% increase year-on-year.
While unit approvals are down from their peak, the 2,721 approvals in May 2018 was 14.8% higher over the month and 36.4% higher year-on-year.
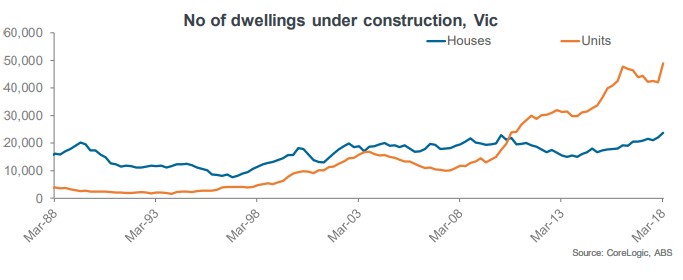
An historic high number of dwellings are under construction across Vic
According to the ABS there were 73,290 dwellings under construction across Vic at the end of March 2018, which was an historic high.
The 73,290 is split between: a record high 23,804 new houses, an historic high 48,971 new units and 515 non-new dwellings.
There was a significant rebound in the number of dwellings under construction across the state over the quarter with the number under construction now 7.6% higher than the previous record high.
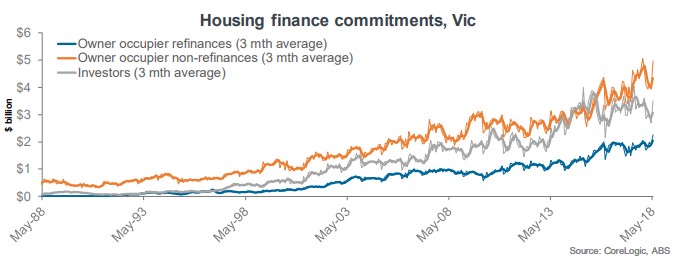
Housing finance commitments rose across all segments in May 2018
The total value of housing finance commitments in Vic during May 2018 was $10.7 billion which was 26.0% higher over the month and a new record high.
The $10.7 billion was split between: $2.3 billion in owner occupier refinances, $5.0 billion in owner occupier new lending and $3.5 billion in lending to investors.
While all segments of lending have rebounded, lending to investors as a share of total lending has trended much lower over recent months.

No comments:
Post a Comment