How unaffordable is the Sydney property market?
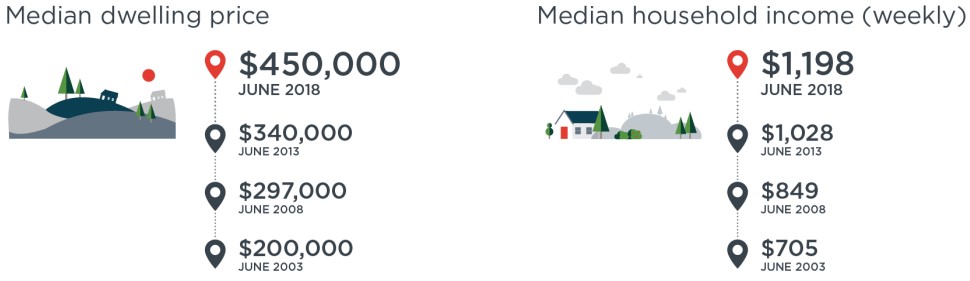
As at June 2018, Sydney was the nation’s least affordable housing market across each of the three purchasing metrics and rental affordability was only marginally lower than the most unaffordable market, Hobart.
With recent declines in prices there has been a slight improvement on the price based metrics over the past quarter.
Over the past five years, median dwelling prices have increased by 51.0% compared to household incomes increasing by just 16.1%.
It has been a similar story over the past decade with median price growth (89.0%) more than double the household income growth (42.0%).


| SA3 Region | Dwelling price to income ratio | Yrs to save a 20% deposit based on saving 15% of household income | % of household income required to service an 80% LVR mortgage | % of household income required to rent a home |
| Auburn | 9.0 | 12.0 | 48.1% | 33.9% |
| Bankstown | 12.5 | 16.6 | 66.5% | 36.6% |
| Baulkham Hills | 10.7 | 14.3 | 57.0% | 26.5% |
| Blacktown | 8.4 | 11.2 | 44.8% | 27.1% |
| Blacktown – North | 7.5 | 10.0 | 40.0% | 23.9% |
| Blue Mountains | 8.6 | 11.4 | 45.6% | 30.3% |
| Botany | 10.7 | 14.2 | 56.8% | 35.0% |
| Bringelly – Green Valley | 8.3 | 11.0 | 44.0% | 28.3% |
| Camden | 6.7 | 9.0 | 36.0% | 23.2% |
| Campbelltown (NSW) | 8.1 | 10.9 | 43.4% | 28.1% |
| Canada Bay | 11.2 | 14.9 | 59.5% | 31.9% |
| Canterbury | 11.1 | 14.8 | 59.0% | 34.3% |
| Carlingford | 13.0 | 17.3 | 69.4% | 31.9% |
| Chatswood – Lane Cove | 11.4 | 15.2 | 60.9% | 28.2% |
| Cronulla – Miranda – Caringbah | 11.5 | 15.3 | 61.1% | 29.7% |
| Dural – Wisemans Ferry | 14.7 | 19.6 | 78.5% | 29.8% |
| Eastern Suburbs – North | 14.5 | 19.4 | 77.4% | 32.4% |
| Eastern Suburbs – South | 13.3 | 17.7 | 70.8% | 34.0% |
| Fairfield | 11.5 | 15.3 | 61.4% | 35.4% |
| Gosford | 10.1 | 13.4 | 53.7% | 33.6% |
| Hawkesbury | 8.9 | 11.9 | 47.6% | 24.9% |
| Hornsby | 9.8 | 13.0 | 52.1% | 26.4% |
| Hurstville | 11.6 | 15.5 | 61.9% | 33.5% |
| Kogarah – Rockdale | 9.7 | 12.9 | 51.6% | 33.3% |
| Ku-ring-gai | 13.7 | 18.3 | 73.2% | 27.9% |
| Leichhardt | 12.0 | 16.0 | 64.1% | 31.1% |
| Liverpool | 9.0 | 12.0 | 48.0% | 29.5% |
| Manly | 13.3 | 17.7 | 70.8% | 30.3% |
| Marrickville – Sydenham – Petersham | 11.5 | 15.4 | 61.6% | 29.8% |
| Merrylands – Guildford | 11.5 | 15.3 | 61.3% | 35.8% |
| Mount Druitt | 7.9 | 10.5 | 42.0% | 27.1% |
| North Sydney – Mosman | 10.7 | 14.2 | 57.0% | 28.6% |
| Parramatta | 7.1 | 9.5 | 38.0% | 26.4% |
| Pennant Hills – Epping | 12.5 | 16.6 | 66.5% | 25.9% |
| Penrith | 7.4 | 9.9 | 39.4% | 24.6% |
| Pittwater | 13.9 | 18.5 | 74.2% | 34.8% |
| Richmond – Windsor | 8.4 | 11.2 | 44.8% | 29.1% |
| Rouse Hill – McGraths Hill | 9.4 | 12.6 | 50.3% | 26.1% |
| Ryde – Hunters Hill | 12.2 | 16.3 | 65.2% | 29.3% |
| St Marys | 8.1 | 10.8 | 43.3% | 26.6% |
| Strathfield – Burwood – Ashfield | 9.1 | 12.2 | 48.7% | 30.0% |
| Sutherland – Menai | ||||
| Heathcote | 9.1 | 12.2 | 48.8% | 25.9% |
| Sydney Inner City | 9.4 | 12.5 | 50.0% | 34.4% |
| Warringah | 11.7 | 15.6 | 62.5% | 29.1% |
| Wollondilly | 7.5 | 9.9 | 39.8% | 23.9% |
Regional NSW

With fairly rapid growth in median prices over recent years and minimal income growth, housing affordability has deteriorated over recent years across regional NSW.
Over the past quarter, median prices have begun to fall which is resulting in a slight improvement in affordability.
Over the five years to June 2018, median dwelling prices have increased at almost double the rate (32.4%) of household incomes (16.6%).
Over the decade to June 2018 median prices and household incomes have grown at a much closer pace of 51.5% and 41.1% respectively.

| SA3 Region | Dwelling price to income ratio |
Yrs to save a 20% deposit based on saving 15% of household income |
% of household income required to service an 80% LVR mortgage |
% of household income required to rent a home |
|||||
| Albury | 4.7 | 6.3 | 25.0% | 23.4% | |||||
| Armidale | 5.4 | 7.2 | 29.0% | 27.8% | |||||
| Bathurst | 5.8 | 7.8 | 31.1% | 25.1% | |||||
| Bourke – Cobar – | |||||||||
| Coonamble | 2.7 | 3.6 | 14.2% | 23.7% | |||||
| Broken Hill and Far West | 2.0 | 2.7 | 10.7% | 24.9% | |||||
| Clarence Valley | 7.6 | 10.2 | 40.6% | 41.7% | |||||
| Coffs Harbour | 8.2 | 11.0 | 43.9% | 35.7% | |||||
| Dapto – Port Kembla | 9.3 | 12.5 | 49.8% | 35.8% | |||||
| Dubbo | 5.0 | 6.6 | 26.5% | 26.2% | |||||
| Goulburn – Mulwaree | 6.7 | 8.9 | 35.5% | 28.9% | |||||
| Great Lakes | 9.9 | 13.2 | 52.7% | 41.7% | |||||
| Griffith – Murrumbidgee | |||||||||
| (West) | 3.9 | 5.3 | 21.0% | 22.4% | |||||
| Inverell – Tenterfield | 5.0 | 6.6 | 26.6% | 31.7% | |||||
| Kempsey – Nambucca | 7.6 | 10.1 | 40.3% | 38.2% | |||||
| Kiama – Shellharbour | 9.1 | 12.1 | 48.5% | 33.3% | |||||
| Lachlan Valley | 4.1 | 5.5 | 22.1% | 23.9% | |||||
| Lake Macquarie – East | 8.4 | 11.2 | 44.6% | 30.5% | |||||
| Lake Macquarie – West | 7.8 | 10.4 | 41.4% | 30.2% | |||||
| Lithgow – Mudgee | 6.3 | 8.4 | 33.4% | 29.8% | |||||
| Lower Hunter | 5.7 | 7.6 | 30.3% | 26.8% | |||||
| Lower Murray | 3.4 | 4.6 | 18.2% | 22.3% | |||||
| Maitland | 6.1 | 8.1 | 32.5% | 26.4% | |||||
| Moree – Narrabri | 3.9 | 5.2 | 21.0% | 25.2% | |||||
| Newcastle | 8.4 | 11.2 | 44.8% | 30.6% | |||||
| Orange | 5.5 | 7.3 | 29.2% | 25.1% | |||||
| Port Macquarie | 9.2 | 12.2 | 48.8% | 37.0% | |||||
| Port Stephens | 8.2 | 11.0 | 43.9% | 33.5% | |||||
| Queanbeyan | 5.4 | 7.2 | 28.7% | 20.3% | |||||
| Richmond Valley – Coastal | 11.4 | 15.2 | 60.9% | 46.6% | |||||
| Richmond Valley – Hinterland | 6.7 | 8.9 | 35.8% | 34.4% | |||||
| Shoalhaven | 10.4 | 13.8 | 55.4% | 39.2% | |||||
| Snowy Mountains | 4.6 | 6.2 | 24.8% | 22.7% | |||||
| South Coast | 8.7 | 11.5 | 46.2% | 38.6% | |||||
| Southern Highlands | 11.2 | 14.9 | 59.7% | 37.7% | |||||
| Tamworth – Gunnedah | 5.2 | 7.0 | 27.8% | 26.3% | |||||
| Taree – Gloucester | 8.0 | 10.7 | 42.9% | 36.5% | |||||
| Tumut – Tumbarumba | 3.8 | 5.1 | 20.5% | 24.3% | |||||
| Tweed Valley | 9.6 | 12.8 | 51.3% | 43.7% | |||||
| Upper Hunter | 4.7 | 6.2 | 24.9% | 23.9% | |||||
| Upper Murray exc. | |||||||||
| Albury | 4.5 | 5.9 | 23.8% | 23.2% | |||||
| Wagga Wagga | 4.5 | 6.0 | 24.0% | 24.2% | |||||
| Wollongong | 10.4 | 13.8 | 55.3% | 32.5% | |||||
| Young – Yass | 5.2 | 7.0 | 28.0% | 20.5% |
No comments:
Post a Comment