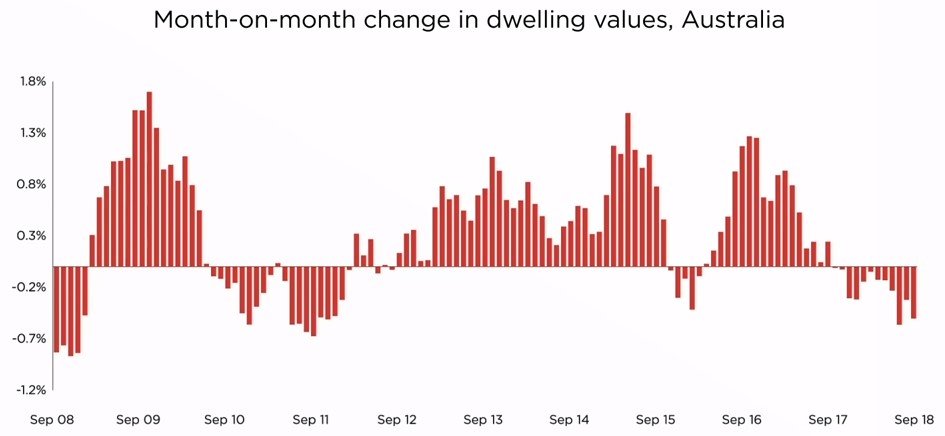
The Australian housing market continued to weaken over the month, with national dwelling values falling 0.5% in September, marking twelve month of consistently falling values across CoreLogic`s national hedonic home value index.

Dwelling values tracked lower across five of the eight capital cities in September while five of the seven «rest of state» regions recorded a fall in values over the month.
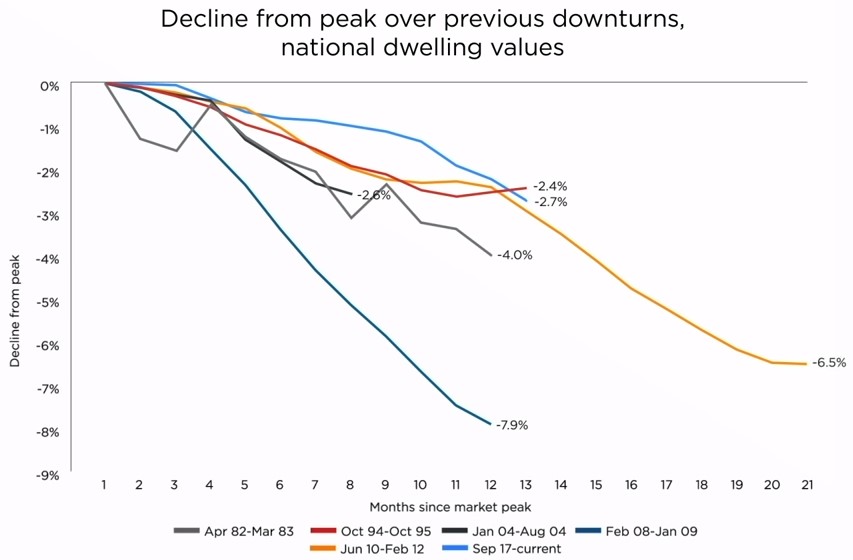
Since the national index peaked twelve months ago, dwelling values have fallen by 2.7%; hardly a crash, and a slower rate of decline relative to the previous housing market downturn which ran between June 2010 and February 2012.
National dwelling values fell by 3.0% over the first twelve months of this previous national downturn declining 6.5% from peak to trough.
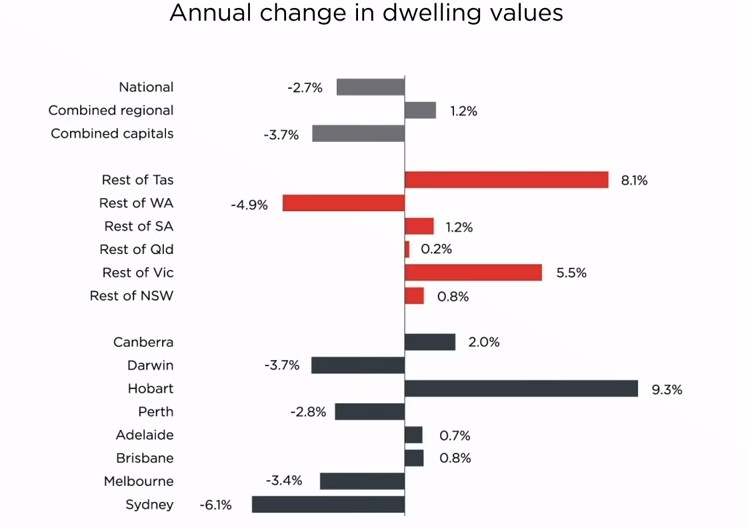
While the housing market downturn is well entrenched across Darwin and Perth where dwelling values remain 22% and 13% lower relative to their 2014 peak, Sydney and Melbourne are now the primary drag on the national housing market performance.
We`ve seen Sydney dwelling values drop 6.1% over the past twelve months and Melbourne values are 3.4% lower.

Regional markets, where housing values have generally been more resilient to falls than in the capital cities, are now showing more challenging conditions.
Despite regional Western Australia being the only «rest of state» region to record a decline in dwelling values over the past twelve months, the September quarter saw values dropping across the regional areas of New South Wales, Victoria, Queensland, and South Australia as well as regional WA.
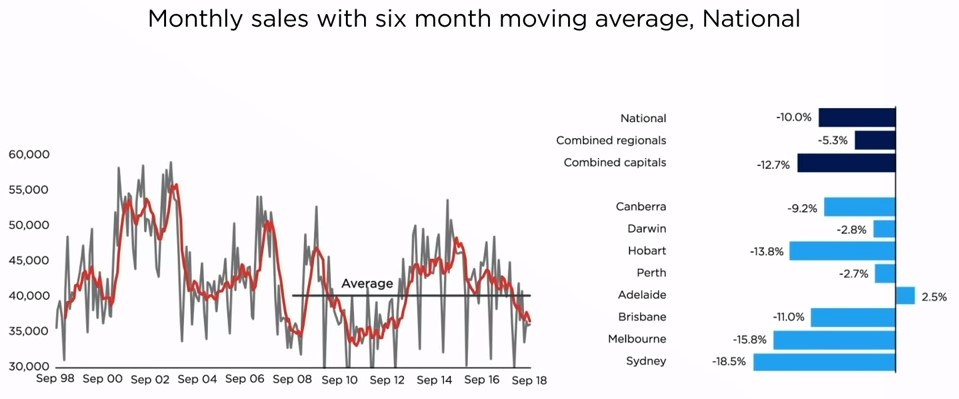
As housing market conditions have slowed and credit is less available, buyer numbers have thinned out.
CoreLogic estimates of settled sales are down 10% year on year nationally, while previously strong markets such as Sydney and Melbourne have seen the number of settled sales fall more substantially, down 19% and 16% respectively.
Listing numbers
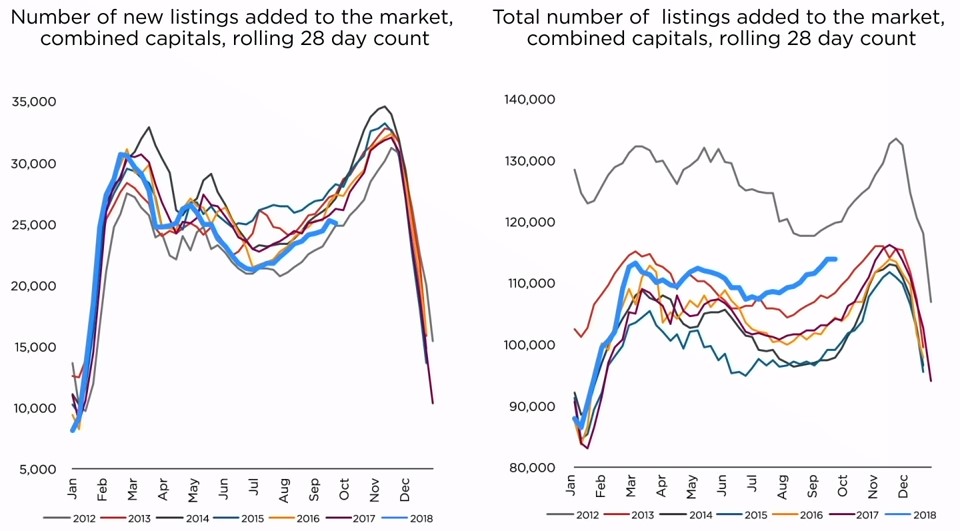
As the market moves through spring, new listing numbers have commenced their seasonal rise.
 Despite listing numbers starting to wind up, the number of freshly advertised properties remains well below previous years, reflecting a deterioration in vendor confidence.
Although new listings are lower than previous years, the total number of properties available for sale has been climbing higher to be 9.5% higher than a year ago across the combined capital cities.
The surge in total listing numbers is highest in Sydney and Melbourne where stock levels are now 22% and 17% higher than a year ago.
The lift into total stock levels isn`t due to vendors dumping more stock on the market — this trend simply reflects a slower rate of absorption.
More stock to choose from means buyers are generally more empowered and vendors are finding properties are taking longer to sell.
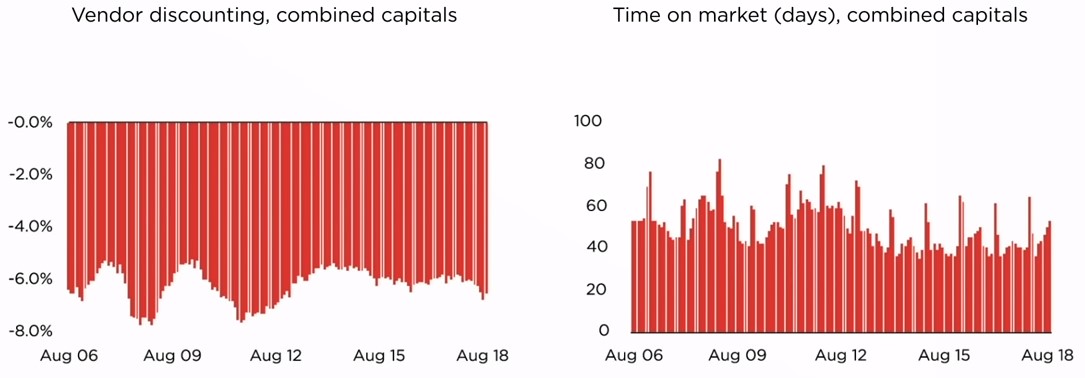
Capital city dwellings are taking 53 days on average to sell – an increase of 11 days from a year ago.
Vendors are having to discount their asking prices by a larger margin as well, with the initial asking price reducing by an average of 6.5% before selling.
No comments:
Post a Comment