Figures released reveal national residential listings rose a modest 1.0% in September 2018 to 335,854, with a greater rise normally registered for the first month of the Spring selling season.
Property listings rose 0.3% in Sydney, to be up 18.7% higher from a year ago.
In Melbourne, listings actually fell by 1.8% in September, though they are 13.8% higher than a year earlier.
Stock levels rose modestly in Canberra by 0.4% while in Hobart they edged higher by 0.5%, but remain down 15% from a year ago, reflecting a continuing shortage of properties available for sale there.

Key Points
- National residential listings rose 1.0% in September 2018 from August.

- Listings rose by 0.3% in Sydney, up 18.7% higher from a year ago.
- Melbourne listings fell 1.3%, but are up 13.8% higher over the year.
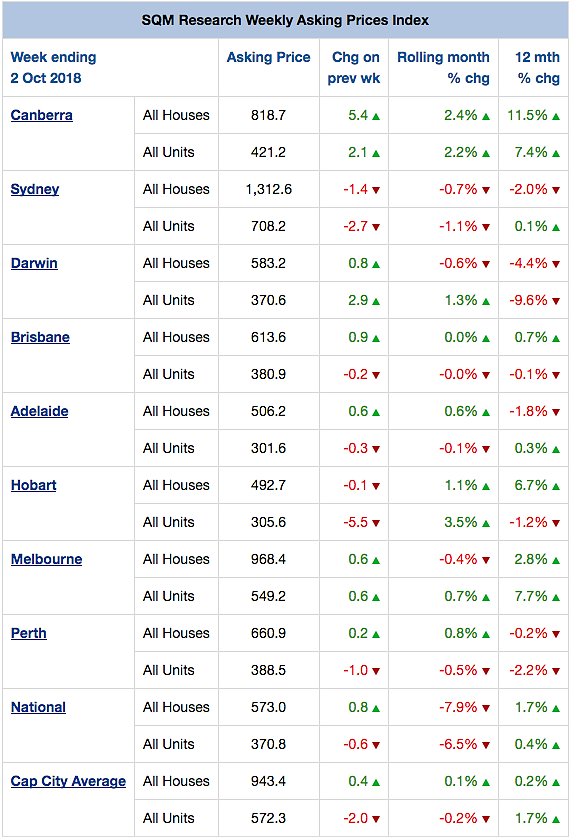
- Capital city average asking prices rose just 0.1% for houses to $943,400 while unit asking prices fell 0.2% to $572,300 over the month to 2 October.
Listings rose 1.2% in Brisbane from August and by 3.7% in Adelaide.
In Perth, stock on market fell 1.3% in September while Darwin’s listings increased by 2.6%.
A greater rise is normally registered for September.
It may be that the correction in property prices has dissuaded from people from listing their properties for sale in Australia’s biggest cities.
As it is, Sydney’s property prices have been overvalued and we are now seeing them fall, with asking house prices down by 2.0% over the month to 2 October.
Asking Prices
Capital city average asking prices rose just 0.1% for houses to $943,400 while unit asking prices fell 0.2% to $572,300 over the month to 2 October.

Asking house prices in Sydney fell by 0.7% to $1.31 million, to be down 2.0% from a year earlier.
Unit prices too fell by 1.1% in Sydney to $708,200, as the property market corrects from its previous highs.
Melbourne asking house prices fell to $968,400, though unit prices were up 0.7% to $549,200.
Canberra’s asking house prices, in contrast, jumped by 2.4% over the month to 2 October to be up 11.5% from a year ago, the greatest growth of any capital city.
Source: www.sqmresearch.com.au
No comments:
Post a Comment