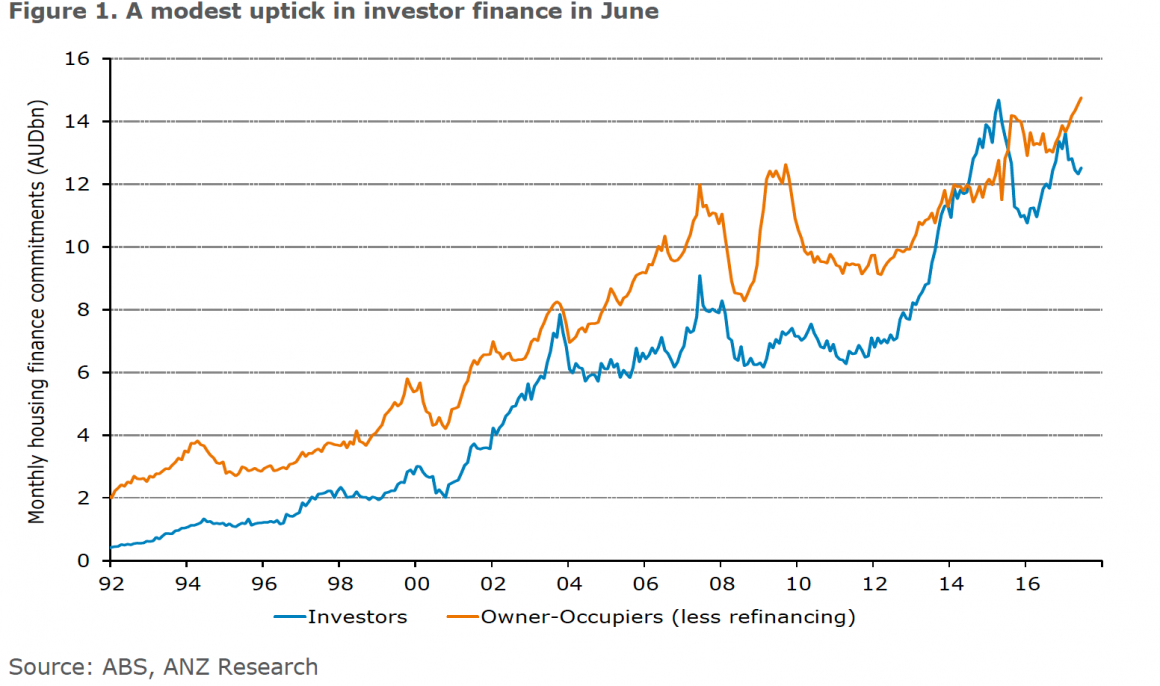
The latest housing finance data just released by the ABS shows investor lending was up 1.6 per cent over the last month.
This is the biggest increase in investor financing since January. 
Clearly APRA’s intervention into Australia’s heated property market isn’t biting as much as the regulator might like.
However this follows a period of reasonably steep monthly falls so it’s too early to conclude it is the start of a serious recovery in investor lending.
Reflecting this, the annual growth of investor financing slowed to 5.7% – its weakest pace since August 2016.
Of course a marked increase of investor financing would be a disturbing development for APRA who could tighten macro prudential controls further, and for the RBA who really don’t want to increase interest rates at present.
RateCity.com.au Money Editor Sally Tindall says the results show investors are still in the game.
“The APRA intervention initially took the steam out of the property market, but the latest figures confirm buyers are choosing to wear the rate hikes.
“APRA has been focused on deterring investor growth over two years now with limited success. If they’re serious about reducing the dominance of investors, APRA may have to introduce a bigger stick to fend them off.
“Interestingly, the percentage of fixed rate loans has increased from 11.2 per cent last September to 17.5 per cent in June, which represents the highest percentage of fixers since November 2013.
“This is a clear reaction to the out of cycle rate hikes from the banks as borrowers move to protect themselves from future increases.
“RateCity data shows that fixed rates bottomed out in November of last year, when 12.5 per cent of people fixed however it’s taken borrowers over half a year to realise the bottom of the market has passed.
“With the spring real estate market just around the corner and auction rates continuing to make modest improvements, it will be interesting to see whether it will be game on again for the spring property market,” said Ms Tindall.

| 3-yr owner-occ (avg) | 3-yr investor (avg) | 5-yr owner-occ (avg) | 5-yr investor (avg) | |
| Nov 2016 | 3.99% | 4.19% | 4.46% | 4.61% |
| July 2017 | 4.21% | 4.49% | 4.63% | 4.89% |
| Change | 0.22% | 0.30% | 0.16% | 0.28% |
No comments:
Post a Comment