Resi prices steady in Q1
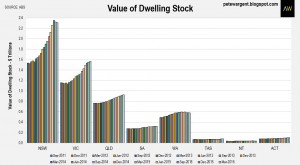
The ABS Residential Property Price Indexes figures for the March 2016 quarter showed the total value of dwelling stock inching up to a grand total of $5,993,992,000 or $5.99 trillion, which is 3.6 times the size of Australia’s GDP (*golf claps*).
Since Q3 2011, defying alarmist predictions of a 40 per cent correction, the total value of dwelling stock has increased by more than $1.5 trillion, with the aggregate gains driven by New South Wales ($709 billion), Victoria ($387 billion), and Queensland ($141 billion).
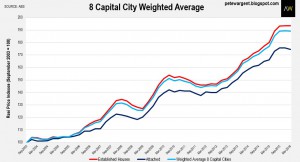
At the national level, attached dwellings have under-performed – although not so much in Sydney where affordability issues are at their most acute – largely due to an emerging oversupply of new high rise apartments in some areas.
The national result showed capital city prices slightly down by -0.2 per cent in the first quarter of 2016, although these figures pre-date any impact from the latest interest rate cut, with prices now on the rise again in many parts.
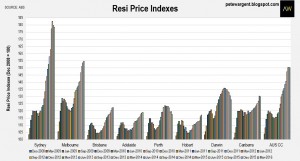
Over the year to March 2016 the best performing markets were Sydney (+9.7 per cent), Melbourne (+9.8 per cent), Canberra (+4.6 per cent), Hobart (+4.2 per cent). and Brisbane (+4.1 per cent).
However, prices were down year-on-year in Perth (-4.5 per cent) and Darwin (-4.7 per cent).
Mr. Consistent
Sydney, Perth, Darwin, and Canberra all saw their price indexes decline in the first quarter.
In Sydney’s case the inner suburbs are still performing strongly – very strongly in many cases, with some massive results being recorded – but secondary locations have come off quite a bit since the third quarter of 2015.
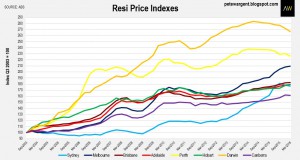
Brisbane clung on to its “Mr. Consistent” tagline, notching up its 15th consecutive quarterly gain – prices in Brisbane are up by a steady 22.4 per cent since the financial crisis.
House price analysis often suffers from the cherry picking of start dates – I’ve done it myself in teh chart above – and you can pretty much make the data say almost whatever you want.
For example, by cherry-picking a start date of 2003, I can show Sydney as having been a relative “under-performer” to Melbourne, Perth, and Darwin.
Whereas in reality the median 1995 house price in Sydney was well under $200,000.
It’s about $1 million today.
I’m not sure what you should infer from that.
Basically, unless you are a great market timer – which most people aren’t – capital city buy and hold investment has been an outstanding bet over the long run.
To beat the material transaction costs, market timers would need to have bought and sold well in order to outperform.
The data above does show quite neatly how the resources capitals have cooled off in sympathy with the end of the mining investment boom.
No mean feats
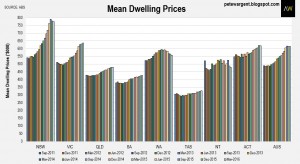
Mean dwelling price growth has generally eased since APRA’s tightening measures, although average prices are still materially higher year-on-year in Sydney (+54,500), Melbourne (+$48,000), Brisbane (+$17,300), Adelaide (+$16,300), and the ACT (+$24,600).
Dwelling stock expands
Finally for today, the ABS also provides some useful figures on the estimated number of dwellings in each state.
The total number of dwellings increased by an estimated 39,000 in the first quarter to 9,661,500, to be 171,700 or 1.8 per cent higher over the year to March.
The chart helps to show how with the largest population, increases in dwelling supply reltatively speaking have a less dramatic effect in New South Wales.
Over the past four years NSW has managed to increase its dwelling stock by just 4.8 per cent, as compared to say 10.8 per cent in the ACT, and 10.3 per cent in the Northern Territory.
Victoria has comfortably been the most efficient planner and builder, adding an impressive 182,700 dwellings in four years, for an increase of 8 per cent.
Since this data series began in September 2011, Victoria has built by far the greatest number of dwellings at 204,800.
The demographics figures are not yet available to March 2016, but the population has likely grown by ~460,000 since that time, so the new supply has generally been well absorbed.
Over the same time period New South Wales has added about 28 per cent fewer dwellings at 146,900, with the population increase over that time being around ~450,000, so generally the new supply has been well absorbed here too.
The wrap
Overall, the March figures showed a cooling of dwelling prices, although more recent indicators have shown activity on the rise again in Sydney since interest rates we
There are some conflicting factors on the horizon for our property markets.
On the positive side of the ledger, the inner suburban capital city markets will likely see a boost from new visa rules effective 1 July.
That having been said, there are some curve balls in the post.
Banks are presently making it more difficult for non-resident borrowers to secure finance, for example, suggesting that regulators are keen to keep a lid on price growth going forward, while some state governments have also made a revenue grab on stamp duty for non-resident buyers.
Further, there is a high volume of supply set to hit the market over the next couple of years, which should help in part to negate the impact of any further monetary easing.



No comments:
Post a Comment