May proved a relatively positive quarter for Australia’s housing market.
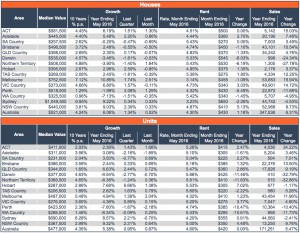
A snapshot of the May statistics is presented in Table 1.
Of the house markets, the Hobart market recorded the strongest quarterly growth gains in May with the median house increasing in value by 2.59%.
This was followed by Country NSW houses, which posted 2.39% growth for the quarter.
In the unit market, the median Hobart unit increased by a shocking 6.66% in the May quarter.
Regional Queensland was a very distant second, where median units increased by 2.44% over the same time period.
Table 1: May 2016 Summary
Source: Residex
Understanding Growth in Hobart
It is highly important to contextualise Hobart’s unit market growth figures because growth has been less consistent over the last five years compared to other cities.
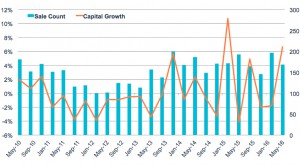
Graph 1 shows a time series of quarterly sales and capital growth for the Hobart unit market.
Graph 1: Quarterly Capital Growth and Sales Numbers – Units, Greater Hobart
Source: Residex
The graph shows that strong growth in the May quarter came off the back of negative growth in the previous two quarters.
It also follows losses in Hobart between 2011 and 2013.
If you invested in the median Hobart unit in May 2010, when the median value was $282,000, you would have made nominal gains of just $5,000 in capital growth over the last five years.
Much of the stunted growth in Hobart is a result of the end of the mining boom and economic growth constraints such as geographic separation from the rest of Australia.
However, as the Australian economy moves away from mining and into tourism, and those close to retirement develop an increased interest for investment properties, Hobart units suddenly present an affordable opportunity with high rental yields – which could account for the rebound of growth in the May quarter.
It is true that tourism has grown in Tasmania.
Visitation to Tasmania and visitor expenditure in Tasmania grew approximately 7% in the year to March 2016.
During this time, most visitors were people within Australia (85%), particularly Victoria (37%).
A persistently low AUD may be encouraging domestic tourism for Australians as opposed to overseas visitations.
Simultaneously, the low AUD could encourage further increases in international visitation, but this too is dependent on the stability of the global economy.
Confidence in the global economy continues to be threatened by heavy migration flows and, in the short term, the possibility of Britain leaving the European Union.
Another important factor to consider is the wider Australian housing market, which is in the downswing phase of the growth cycle.
As growth in housing slows, the wealth effect of housing diminishes, which may also reduce interstate visitation to Tasmania.
Another important consideration for those looking to Tasmania is rent.
The rental yield on the median Hobart unit is currently 5.53%.
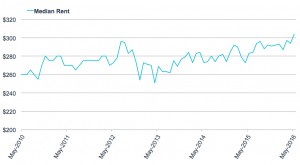
Graph 2 shows the dollar value rent estimates of the median Hobart unit since 2010.
Graph 2: Historical Median Rent – Hobart Units
Source: Residex
Graph 2 shows rent has trended upwards.
In the year to May 2016, rent increased by $20 per week.
However, if wage growth does not prosper with rents, rental return may be held back by affordability problems.
A report by SGS Economics and Planning has found that some households in greater Hobart are spending an estimated 50-80% of their disposable income on ren
Anecdotal reports also argue that homelessness is steadily increasing in the region.
However, the report uses 2011 Census income data, discounting wage growth over the last five years.
As the value of Hobart units increase, rental yields are most likely to fall.
The extent of the fall will depend on the rate of wage growth in the region.
This is an important consideration depending on your investment strategy.
Finally, it is important to consider some of the more endogenous structural growth constraints in Tasmania.
The seasonally adjusted unemployment rate in Tasmania was 6.5% in May, and the state also has the lowest rate of year 12 completion in 20-24 year olds (58%) due to irregular school structures.
Should Labour win government in the upcoming July 2 election, the opposition leader pledged $150 million to the University of Tasmania and small business incentives, to encourage a culture of further education.
The growth potential of Hobart (and its units) may be contingent upon the election outcome.
Seasonality: Winter is Coming
In other parts of Australia, a slowed decline in the resource markets suggests prices in these heavily affected markets are rebounding from a cyclical trough.
Quarterly growth in Perth houses, at 2.08%, was the highest since March 2014.
The steady performance of Australian housing markets in May 2016 could be a culmination of the cash rate cut in May making credit more easily available, and the general seasonal effect of autumn – which has historically seen higher quarterly growth rates in select Australian housing markets.
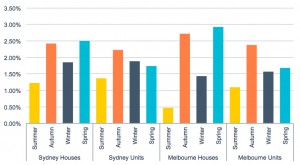
Graph 3 shows the historical 20 year average of quarterly capital growth in houses and units across the seasons in Sydney and Melbourne.
For these markets, winter and summer have proven weaker seasons for capital growth.
Graph 3: Average Seasonal Capital Growth, Last 20 Years
Source: Residex
Across the historical growth rates, standard deviations in each season are low and fairly uniform, suggesting seasonal variations are reliable in these markets.
As the winter season has begun, these markets may experience a slight drop in the rate of capital growth in the August quarter, though historical capital growth over the past 20 years has still been strong.
These seasonal expectations cannot be applied to all markets.
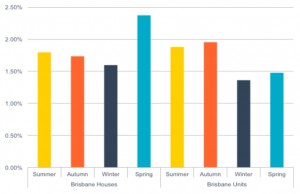
Historical capital growth rates by season in Brisbane (see Graph 4) do not reflect the same historical seasonal growth trends in Sydney and Melbourne.
Graph 4: Brisbane Houses Average Seasonal Capital Growth, Last 20 Years
Source: Residex
Brisbane units are different again to Brisbane houses.
It could be that idiosyncrasies in these markets make purchases and growth stronger at different times.
For example, the purchase or sale of investment properties may be more advantageous before the end of the financial year, making autumn an active time for units over houses in the Brisbane market.
While more research is required before making seasonal generalisations across all markets, winter does seem to deliver persistently lower growth across the markets observed above.
Over the next few months, I would expect to see lower rates of growth across Australian housing markets.
A significant mitigation to this would be continued investment fuelled by the current low interest rates, as well as recent reforms to self managed super funds which currently enable those approaching retirement to borrow and buy.



No comments:
Post a Comment