Many of the property market predictions made this time last year were wrong!
Mine included.
For example…. the Sydney and Melbourne property markets performed much stronger than the commentators expected.
So let’s look more closely at what’s happening in the property markets around Australia and examine the data and graphs provided by CoreLogic.
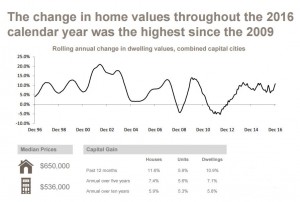
Home values increased by 1.4% in December 2016 with values 2.7% higher over the three months to December 2016 and 10.9% through 2016
- Combined capital city home values increased by 1.4% in December 2016 with values higher across all capital cities except for Adelaide, Darwin and Canberra
- Home values were 2.7% higher over the final quarter of 2016 with Adelaide the only capital city to record a decline in values over the quarter
- Throughout the 2016 calendar year, dwelling values increased by 10.9% which was their greatest calendar year increase since 2009
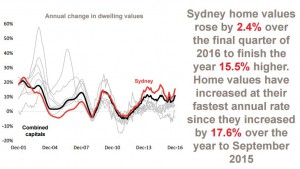
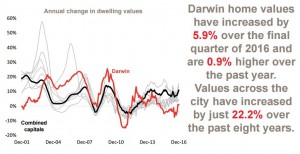
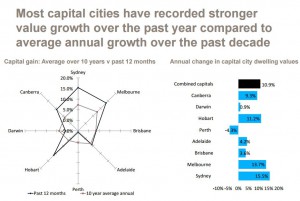
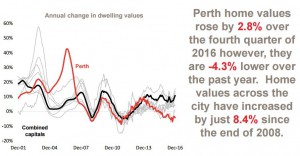
- Across the individual capital cities, the annual change in home values have been recorded at +15.5% in Sydney, +13.7% in Melbourne, +3.6% in Brisbane, +4.2% in Adelaide, -4.3% in Perth, +11.2% in Hobart, +0.9% in Darwin and +9.3% in Canberra
- House values across the combined capital cities increased by 11.6% in 2016 compared to a 5.9% increase in unit values throughout the year.
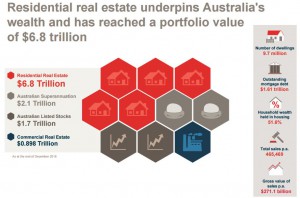
Just look at the size of our property markets:
WHAT THE CHART ABOVE DOESN’T REALLY SHOW IS HOW FRAGMENTED OUR PROPERTY MARKETS REALLY ARE:
The combined capital city index, which is heavily weighted towards the Sydney property market and Melbourne property market, recorded a 10.9% rise over last year, but as you can see in the following graphic capital city growth varies greatly, with the Sydney property market once again the strongest market.
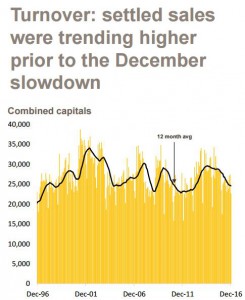
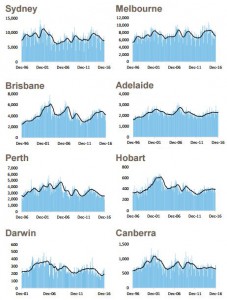
Settled home sales had increased over recent months before their seasonal slowdown in December
- Over the 12 months to December 2016 it is estimated that there were 331,005 houses and 134,364 units sold and settled nationally with house sales -7.3% lower and unit sales -12.2% lower over the year
- Across the combined capital cities there were an estimated 198,260 houses and 97,160 units sold over the 12 months to December 2016. House sales are -10.5% lower over the year while unit sales are down -14.3%
- It is important to note, the large volume of off-the-plan sales currently means there is a high likelihood unit sales volumes will be revised higher over the coming years, these properties will be entered into the database at their contract date but will not be available until they have settled.
Here are some strong signals for our markets:
The average length of time a home sits on the market is trending lower as is the level of discounting taking place
- The typical capital city house is currently selling after 36 days which is unchanged over the year while the typical capital city unit takes 37 days to sell compared to 38 days a year ago
- The average level of discount across the capital cities is recorded at 5.8% for houses and 5.7% for units compared to 6.0% for houses and 5.9% for units 12 months ago
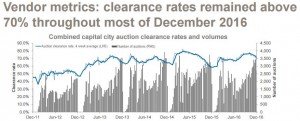
- Auction clearance rates have rebounded in 2016 and during the final quarter of 2016 they were well above levels over the corresponding quarter in 2015.
More properties for sale is a sign of vendor confidence
One of the many reasons our property markets remain so strong is that there are fewer properties for sale at a time when demand form both owner occupiers and investors is still strong.
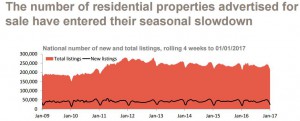
The number of new properties advertised for sale are substantially higher than they were a year ago
- Over the past 28 days there were 24,353 new homes listed for sale nationally and 11,030 of these were listed across the capital cities
- New advertised properties for sale are 17.4% higher than they were a year ago nationally 17.5% higher across the combined capital cities
- There were 214,577 total properties advertised for sale nationally over the past four weeks and 90,712 across the capital cities
- Nationally, total stock for sale is -1.9% lower than a year ago while they are 3.7% higher across the combined capital cities
- New listings have generally been lower relative to a year ago throughout 2016, the fact that they are now so much higher than they were a year ago, at a time of the year when new stock levels typically slows dramatically, highlights the level of market confidence which currently exists amongst vendors.
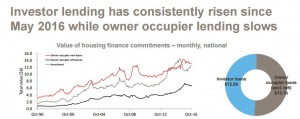
DESPITE APRA’S BEST EFFORTS, INVESTORS ARE STILL VERY ACTIVE IN OUR MARKETS…
WHAT’S HAPPENING AROUND THE STATES?
12 months ago many were prepared to write off the Sydney property market saying that not only was the boom over, but Sydney property values were going to crash.
But Sydney’s fundamentals were strong and after a slight retracement at the beginning of last year, Sydney’s price growth over 2016 was stronger than any other capital city finishing the year up 15.5%.

While overall growth has stagnated, the Brisbane market is very fragmented and there are still some areas that are performing respectably and have good investment prospects.
On the other hand there is a significant oversupply of new high rise off the plan apartments overshadowing the inner city area and nearby suburbs.
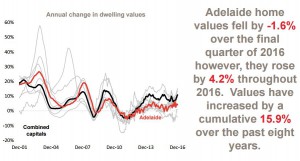
The Adelaide property market has stalled after its little flurry at the beginning of lasy year and home values rose by 4.2% over the year.
There are few growth drivers in Adelaide where unemployment is currently amongst the highest of all capital cities.
The Perth property market is still in its slump phase with a significant oversupply of properties for sale and values still falling.
Similarly the oversupply of rental properties in Perth is causing rents to fall.
There is still some considerable downside to the Perth market as it works its way through the excesses of the mining boom:
Similarly there are few long term growth drivers for Hobart property prices, and even though some commentators are suggesting it’s a good place to invest “because it has to catch up”, with minimal population growth, an ageing population and slow economic growth there seems little reason for property values in Hobart to grow substantially over the long term.
Despite last year’s growth spurt Hobart has underperformed over the last decade with property prices only increasing just over 14% over the last 10 years.

Economic data remains mixed
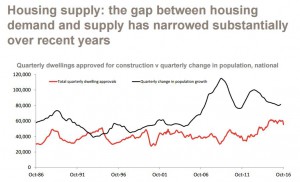
The rate of population growth at a national level is lower than recent highs but has steadied over recent quarters thanks to improving net overseas migration. Victoria is seeing a substantially more rapid rate of population growth than all other states and territories
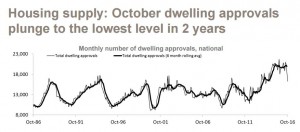
Dwelling approvals fell in October and are being dragged much lower by a slowdown in new unit approvals
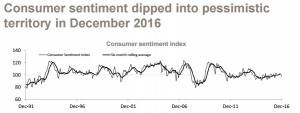
Consumer sentiment remains at a fairly neutral setting although it was more pessimistic than optimistic in December.
As you can see from the graphs below, the number of properties for sale as well as dwelling values are closely linked to consumer sentiment.

New lending to both investors and owner occupiers has fallen from recent peaks with investor lending recording a much greater decline however, investment lending has risen over the past six months while owner occupier mortgage demand has slowed
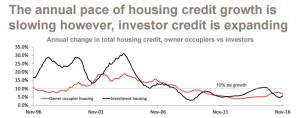
Total housing credit is rising and although annual investment credit growth has slowed and is now well below APRAs 10% threshold for annual growth, monthly data shows growth in investor credit has picked-up over the past seven months’
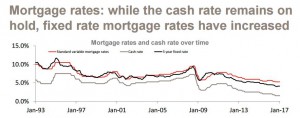
The Reserve Bank left official interest rates on hold at 1.5% in December 2016 and there is no meeting in January however, many lenders have begun lifting rates independently on some mortgage products over recent months.
WHAT CAN YOU DO TO STAY AHEAD? 
If you’re looking for independent advice, no one can help you quite like the independent property investment strategists at Metropole.
Remember the multi award winning team of property investment strategists at Metropole have no properties to sell, so their advice is unbiased.
Whether you are a beginner or a seasoned property investor, we would love to help you formulate an investment strategy or do a review of your existing portfolio, and help you take your property investment to the next level.
Please click here to organise a time for a chat. Or call us on 1300 20 30 30.
When you attend our offices in Melbourne, Sydney or Brisbane you will receive a free copy of my latest 2 x DVD program Building Wealth through Property Investment in the new Economy valued at $49.










No comments:
Post a Comment